 OpenAI - ChatGPT, Sora
 Google - Gemini, Nano Banana
 Anthropic - Claude
 xAI - Grok
 Deepseek
 Alibaba - Qwen
 ByteDance - Doubao
 All Models
 Enterprise Plans
 AI Application Development
 AI Translator API
 AI SEO/GEO Service
 GEO-Optimized PR Service
 Web Scraping Service
 OpenClaw
 Top AI Tools
 Top AI Robots
 Log in

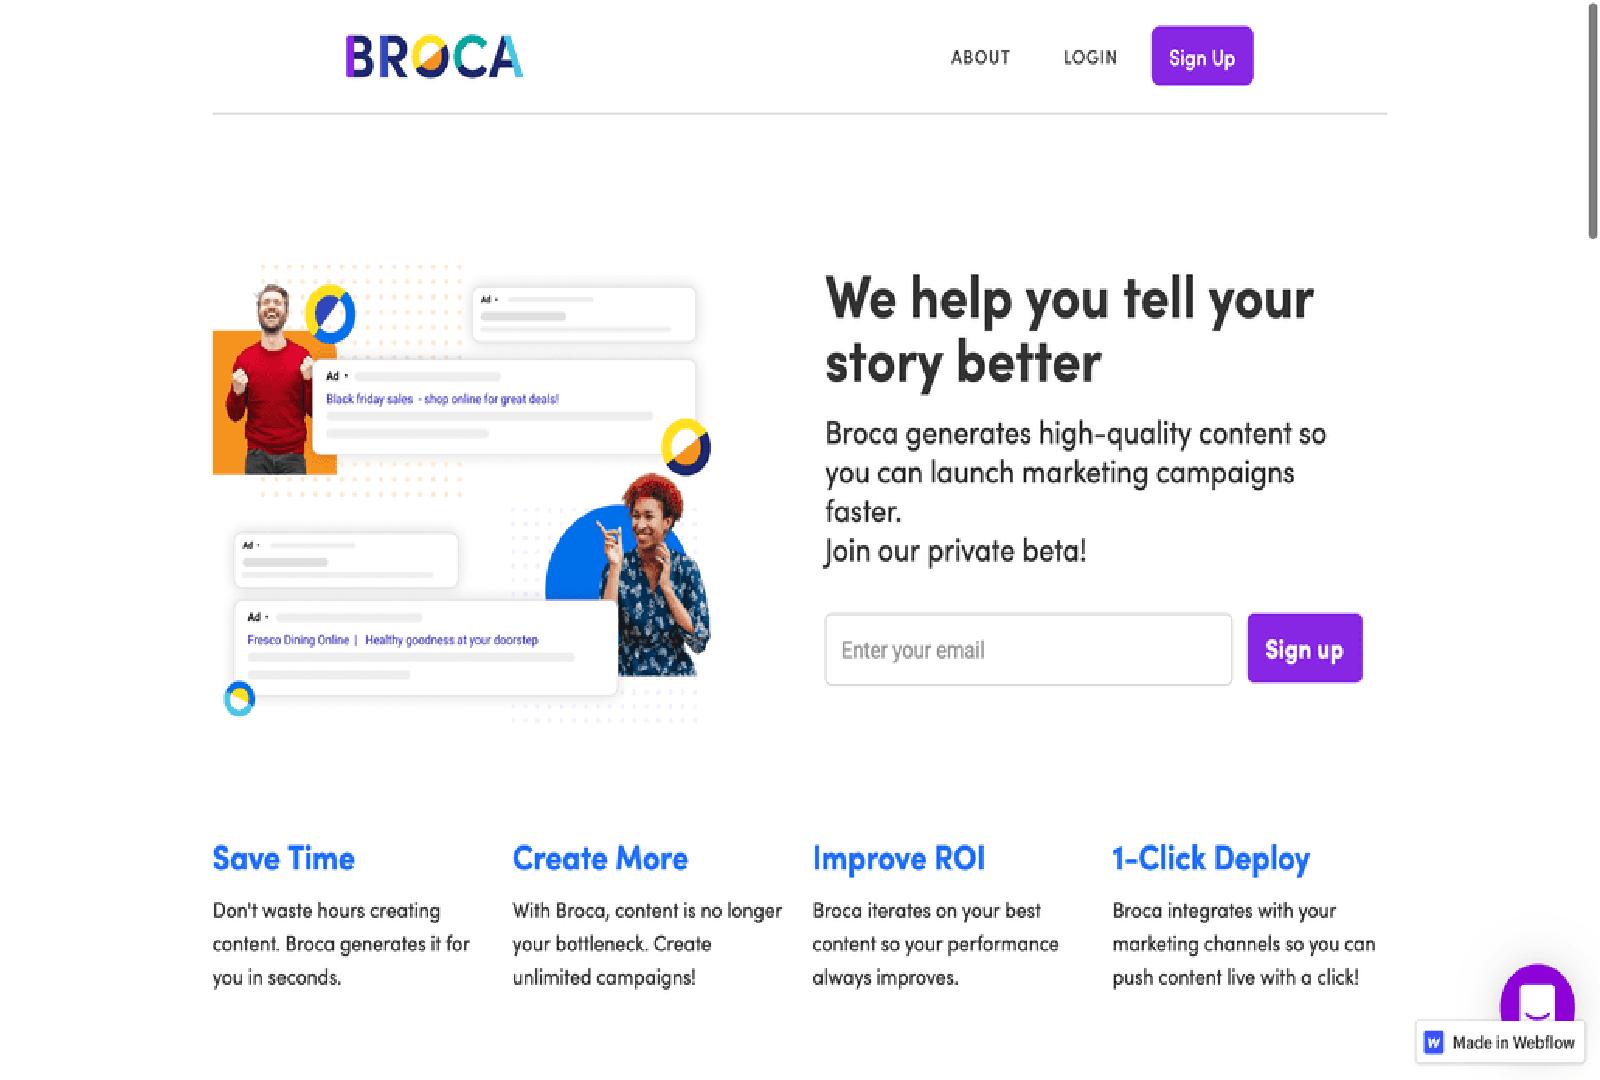

What is Broca?
Broca is a powerful and intuitive tool for data visualization and analysis. It allows users to quickly and easily explore a variety of datasets from multiple sources and present it in a visually engaging and informative way. With Broca, users can quickly and easily create stunning visualizations that provide deep insights into their data.
The platform includes a range of features that make it easy to work with a variety of data sources and formats, including CSV, Excel, and JSON. Additionally, Broca enables users to customize their visualizations with a variety of customization options, including colors, fonts, and labels.
It also offers a range of templates and advanced options to help users create stunning visualizations with just a few clicks. With its intuitive interface, powerful features, and customizable options, Broca is the perfect tool for data analysis and visualization.
Use Cases And Features
1. Generate stunning visualizations with few clicks.
2. Easily explore multiple datasets from different sources.
3. Customize visualizations with colors, fonts and labels.
Tool Website Engagement
Last Update: 2 years ago
- Disclaimer: Statistics sourced from third-party providers. Accuracy may fluctuate.
Total Monthly Visits: 967
Bounce Rate: 0%
Visit Duration (avg): 4.85 seconds
Pages Per Visit: 0.56
Country Rank: 0
Global Rank: 13,699,604
Monthly Traffic
Traffic Sources
Traffic Share By Country
Denmark: 44.78%
Switzerland: 40.98%
Serbia: 14.24%