 OpenAI - ChatGPT, Sora
 Google - Gemini, Nano Banana
 Anthropic - Claude
 xAI - Grok
 Deepseek
 Alibaba - Qwen
 ByteDance - Doubao
 All Models
 Enterprise Plans
 AI Application Development
 AI Translator API
 AI SEO/GEO Service
 GEO-Optimized PR Service
 Web Scraping Service
 OpenClaw
 Top AI Tools
 Top AI Robots
 Log in

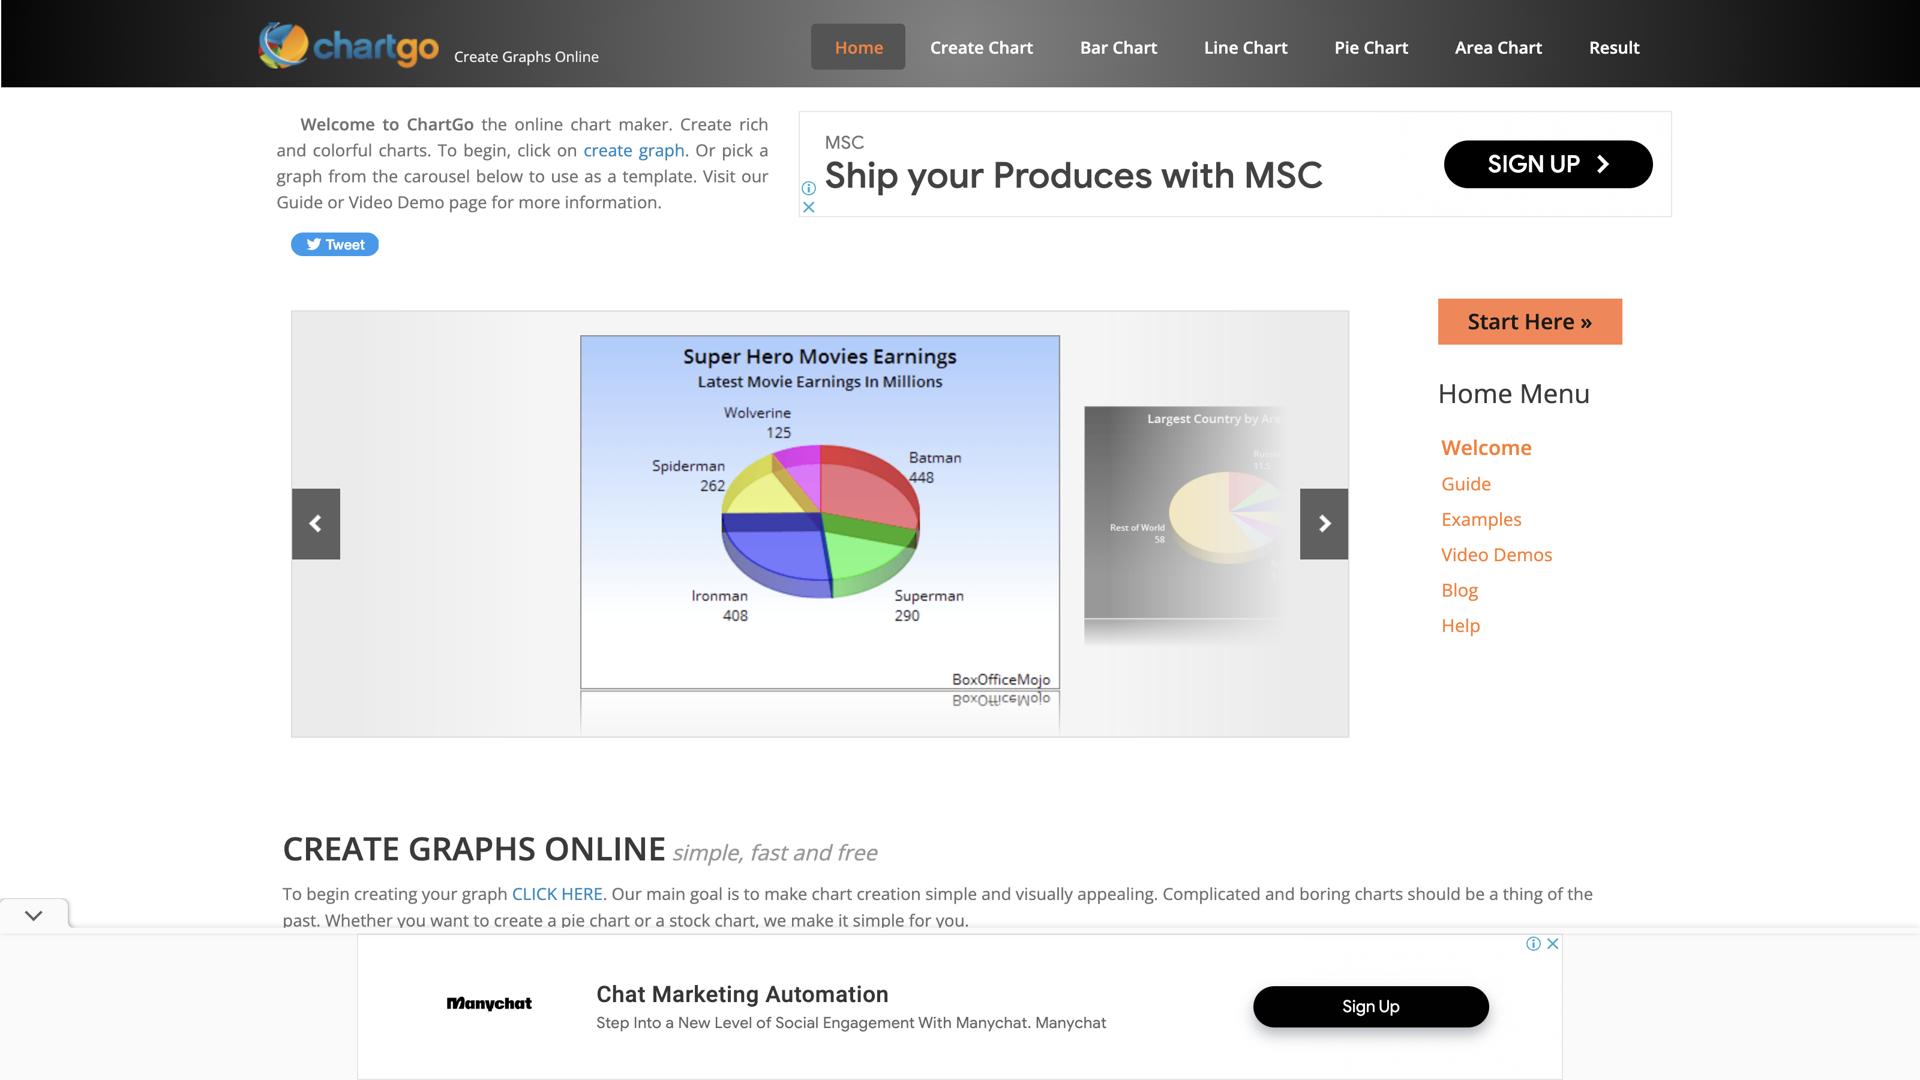

What is Chart Go?
Chart Go is an online charting service that makes it easy to create and customize charts, graphs, and diagrams with just a few clicks. With Chart Go, users can quickly and easily create visuals from any type of data, regardless of its complexity.
With a range of powerful tools, users can customize their charts to their exact specifications, and even add text, images, and animations. Chart Go makes it easy to get professional-looking results in no time, making it ideal for businesses, teachers, and students alike.
Chart Go also features an intuitive drag-and-drop interface, making it easy to quickly build stunning visuals with minimal effort. Plus, users can easily share their creations in a variety of formats, such as PDF, PNG, and SVG.
Chart Go is also highly secure, so users can be sure their data is safe and secure. With Chart Go, users can quickly create stunning visuals that stand out and capture the viewer's attention.
Use Cases And Features
- Create professional-looking visuals quickly with drag-and-drop interface.
- Customize charts to exact specifications with powerful tools.
- Easily share creations in multiple formats like PDF, PNG and SVG.
Tool Website Engagement
Last Update: 2 years ago
- Disclaimer: Statistics sourced from third-party providers. Accuracy may fluctuate.
Total Monthly Visits: 48K
Bounce Rate: 43%
Visit Duration(avg): 137.52 seconds
Pages Per Visit: 1.89
Country Rank: 840
Global Rank: 1,196,191
Monthly Traffic
Traffic Sources
Traffic Share By Country
- Taiwan: 15.40%
- United States: 14.22%
- Andorra: 4.42%
- India: 4.06%
- Mexico: 2.78%