 OpenAI - ChatGPT, Sora
 Google - Gemini, Nano Banana
 Anthropic - Claude
 xAI - Grok
 Deepseek
 Alibaba - Qwen
 ByteDance - Doubao
 All Models
 Enterprise Plans
 AI Application Development
 AI Translator API
 AI SEO/GEO Service
 GEO-Optimized PR Service
 Web Scraping Service
 OpenClaw
 Top AI Tools
 Top AI Robots
 Log in

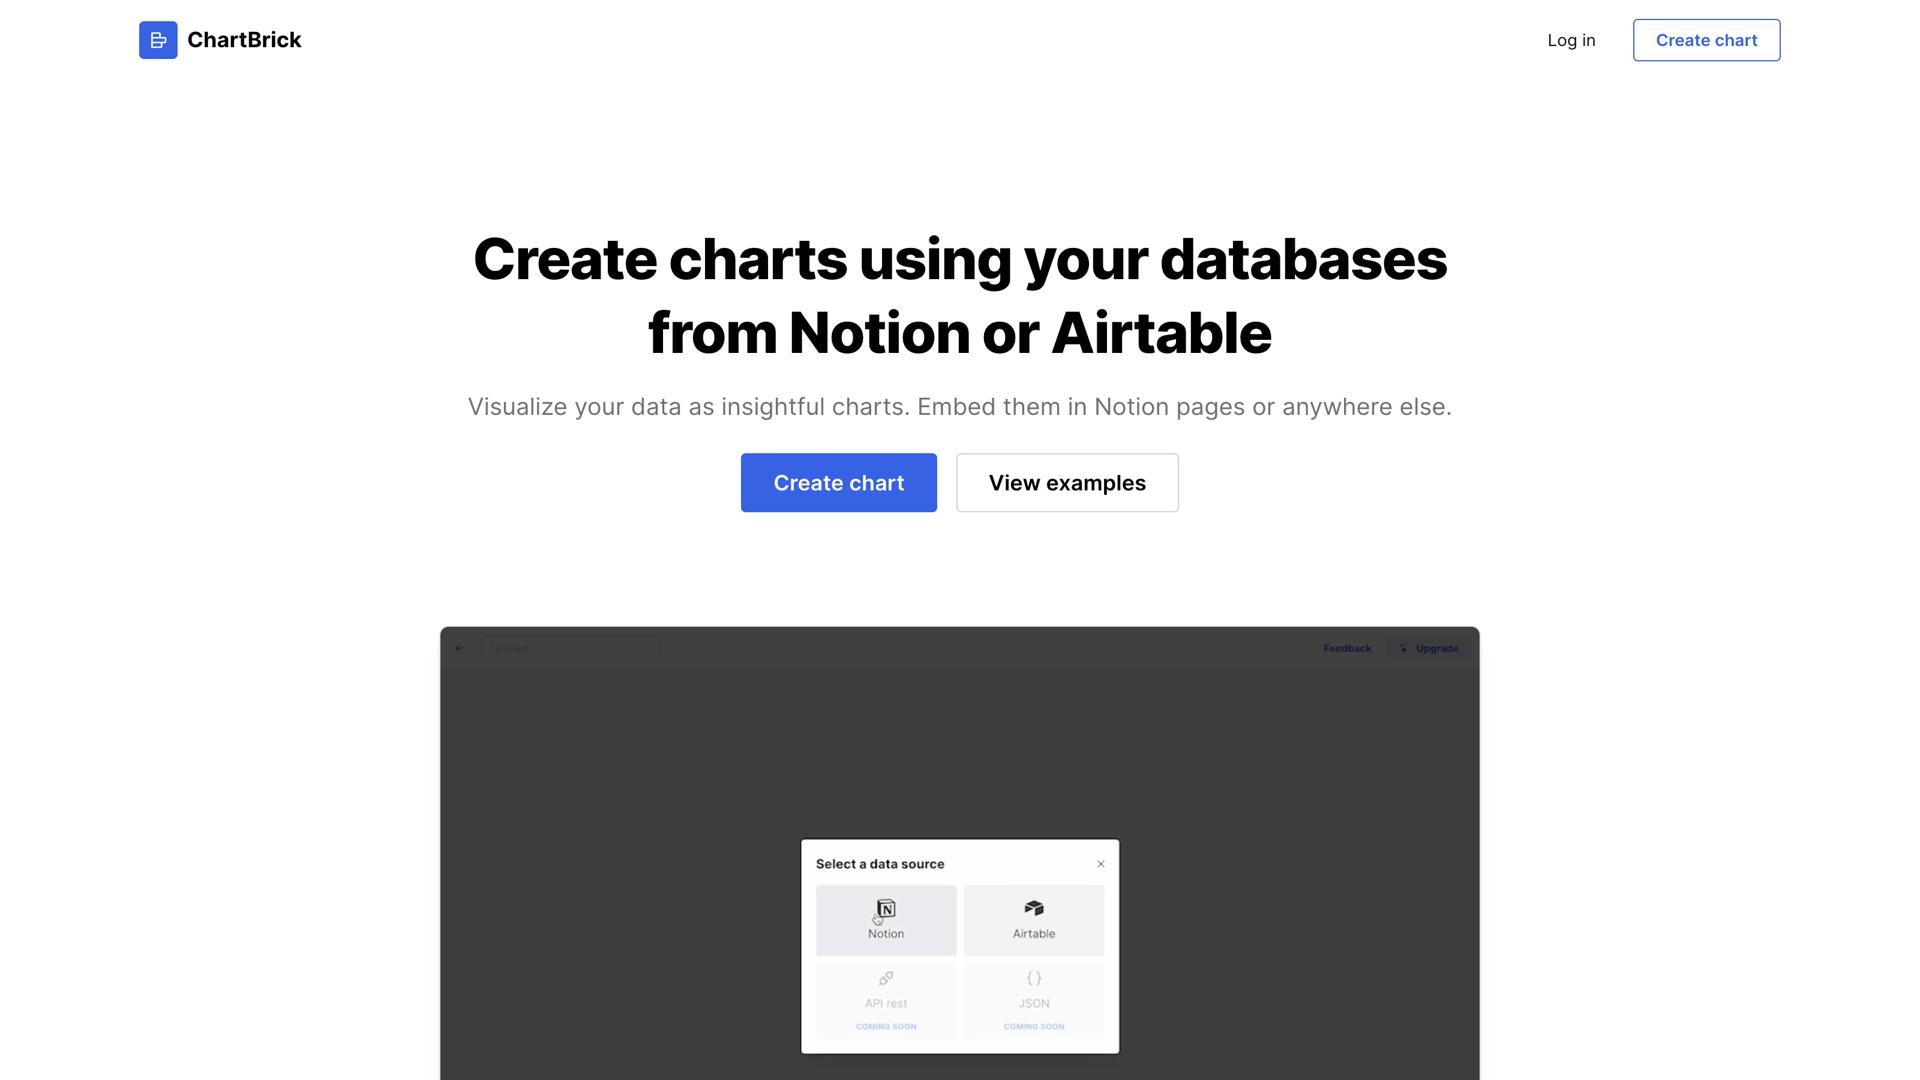

What is ChartBrick?
ChartBrick is a powerful, user-friendly platform designed for data visualization and analysis. With ChartBrick, you can easily and quickly create stunning, interactive charts and data visualizations from your raw data. Whether you're a professional data analyst, a student, or a non-technical user, you can quickly understand your data and uncover valuable insights.
ChartBrick features an intuitive drag-and-drop chart builder, with the ability to customize your charts' look and feel. You can also access a library of pre-made templates and color schemes to make your data look even more visually appealing. With ChartBrick, you can quickly adjust chart settings and parameters, and share your visualizations with others effortlessly.
ChartBrick is the perfect tool for anyone looking to make their data more accessible and visually engaging. It's ideal for business professionals, students, and data enthusiasts who want to easily analyze their data and uncover meaningful insights.
Use Cases And Features
- Quickly create interactive charts and data visualizations
- Customize your charts' look and feel to match your brand
- Access a library of pre-made templates and color schemes
Tool Website Engagement
Last Update: 2 years ago
Disclaimer: Statistics sourced from third-party providers. Accuracy may fluctuate.
Total Monthly Visits: 16K
Bounce Rate: 27%
Visit Duration (avg): 114.03 seconds
Pages Per Visit: 1.09
Country Rank: 0
Global Rank: 3,432,686
Monthly Traffic
Traffic Sources
Traffic Share By Country
- Chile: 7.17%
- Turkey: 6.88%
- Vietnam: 6.47%
- Peru: 5.00%
- Indonesia: 4.88%