 OpenAI - ChatGPT, Sora
 Google - Gemini, Nano Banana
 Anthropic - Claude
 xAI - Grok
 Deepseek
 Alibaba - Qwen
 ByteDance - Doubao
 All Models
 Enterprise Plans
 AI Application Development
 AI Translator API
 AI SEO/GEO Service
 GEO-Optimized PR Service
 Web Scraping Service
 OpenClaw
 Top AI Tools
 Top AI Robots
 Log in

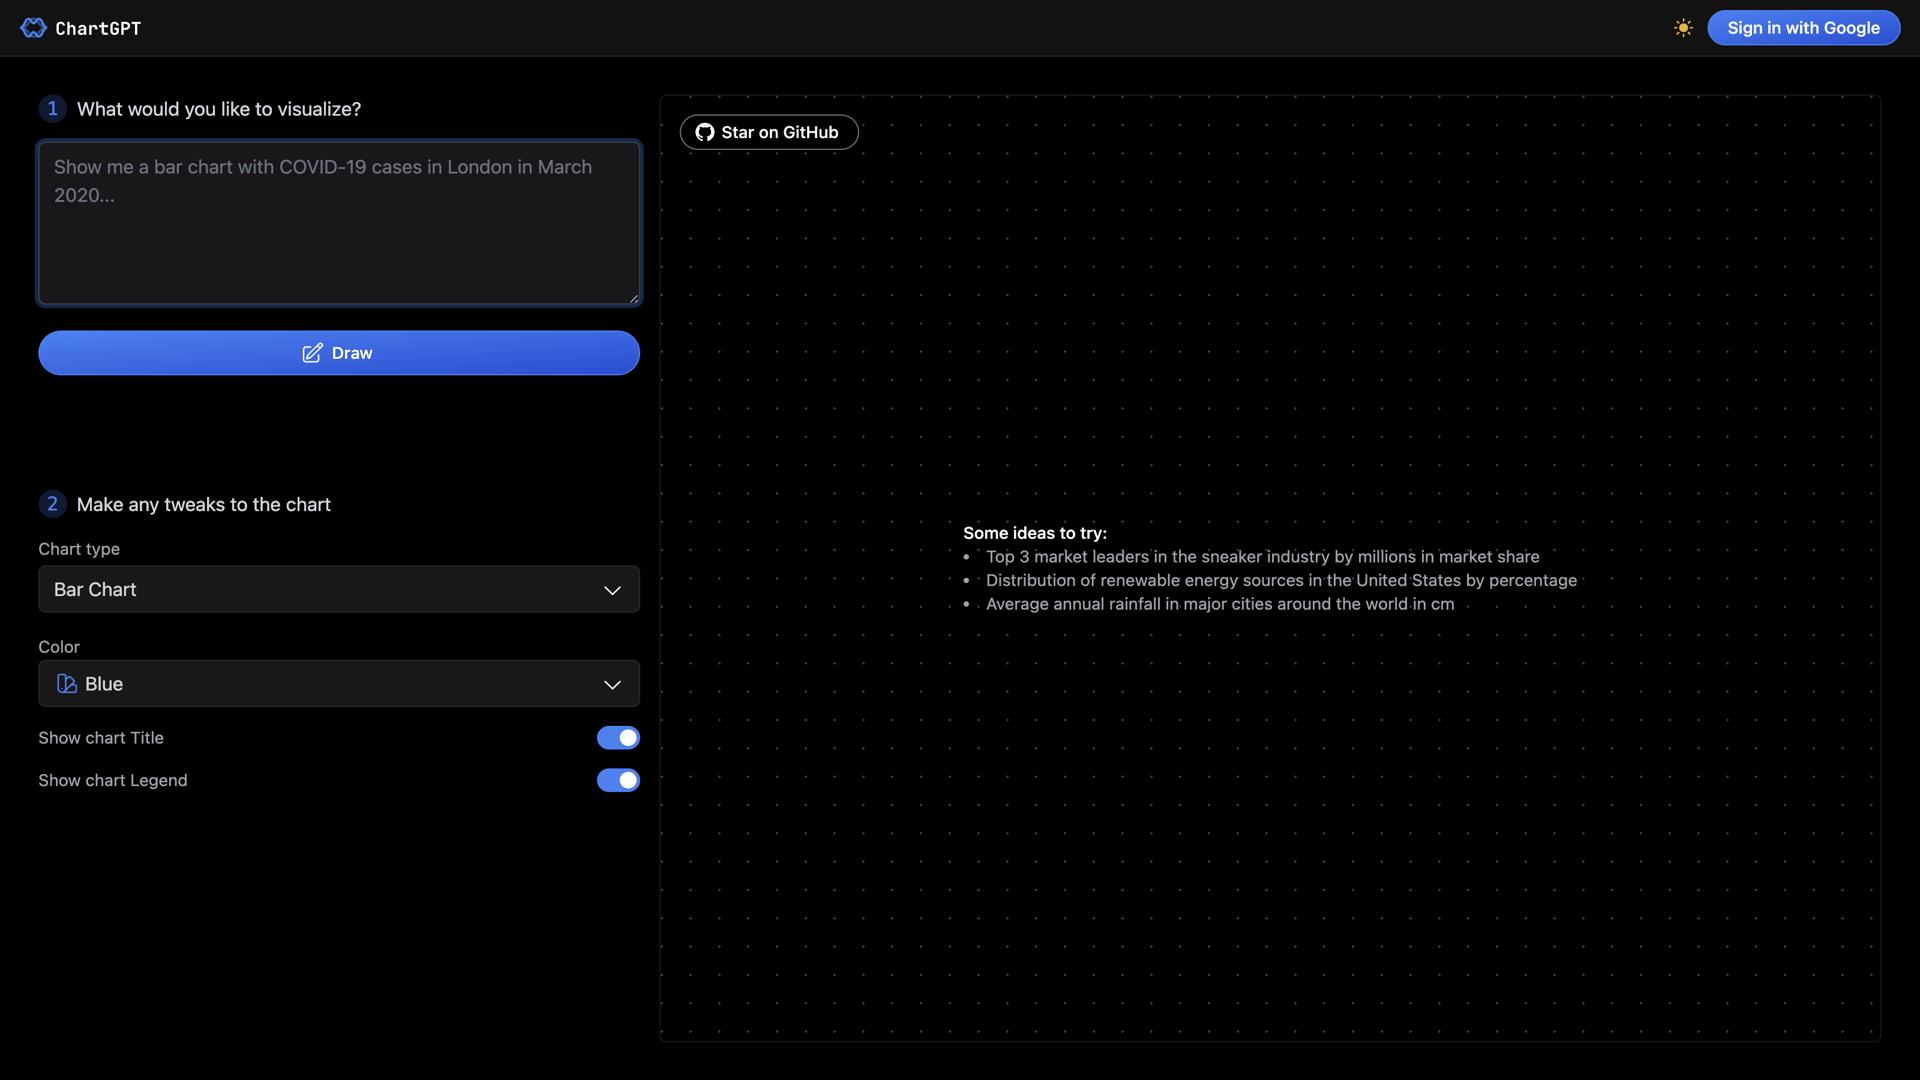

What is ChartGPT?
ChartGPT is an AI-powered tool that simplifies the process of creating charts. With this software, you can transform text-based data into visually striking, interactive charts in minutes. Powered by React, Nextjs, OpenAI, and Tailwind CSS, ChartGPT eliminates the need for manual design and coding, and enables you to quickly generate charts with a few simple steps.
With ChartGPT, you can quickly and easily create beautiful charts from text inputs. This tool is perfect for professionals, researchers, and students who need to present data in a visually appealing way. It takes the hassle out of data visualization and allows you to quickly and effortlessly create stunning charts that are sure to capture the attention of any audience.
ChartGPT provides a range of features and benefits to make data visualization easy and accessible. From its intuitive user interface to its AI-driven automation, this software offers everything you need to create charts that stand out.
Use Cases And Features
- Generate visually striking, interactive charts in minutes.
- Transform text-based data into stunning charts.
- Intuitive user interface with AI-driven automation.
Tool Website Engagement
Last Update: 2 years ago
- Disclaimer: Statistics sourced from third-party providers. Accuracy may fluctuate.
Total Monthly Visits: 20K
Bounce Rate: 46%
Visit Duration(avg): 25.12 seconds
Pages Per Visit: 0.48
Country Rank: 0
Global Rank: 4,050,198
Monthly Traffic
Traffic Sources
Traffic Share By Country
- Antigua and Barbuda: 13.42%
- India: 6.24%
- United States: 5.24%
- Germany: 5.14%
- Turkey: 4.38%