 OpenAI - ChatGPT, Sora
 Google - Gemini, Nano Banana
 Anthropic - Claude
 xAI - Grok
 Deepseek
 Alibaba - Qwen
 ByteDance - Doubao
 All Models
 Enterprise Plans
 AI Application Development
 AI Translator API
 AI SEO/GEO Service
 GEO-Optimized PR Service
 Web Scraping Service
 OpenClaw
 Top AI Tools
 Top AI Robots
 Log in

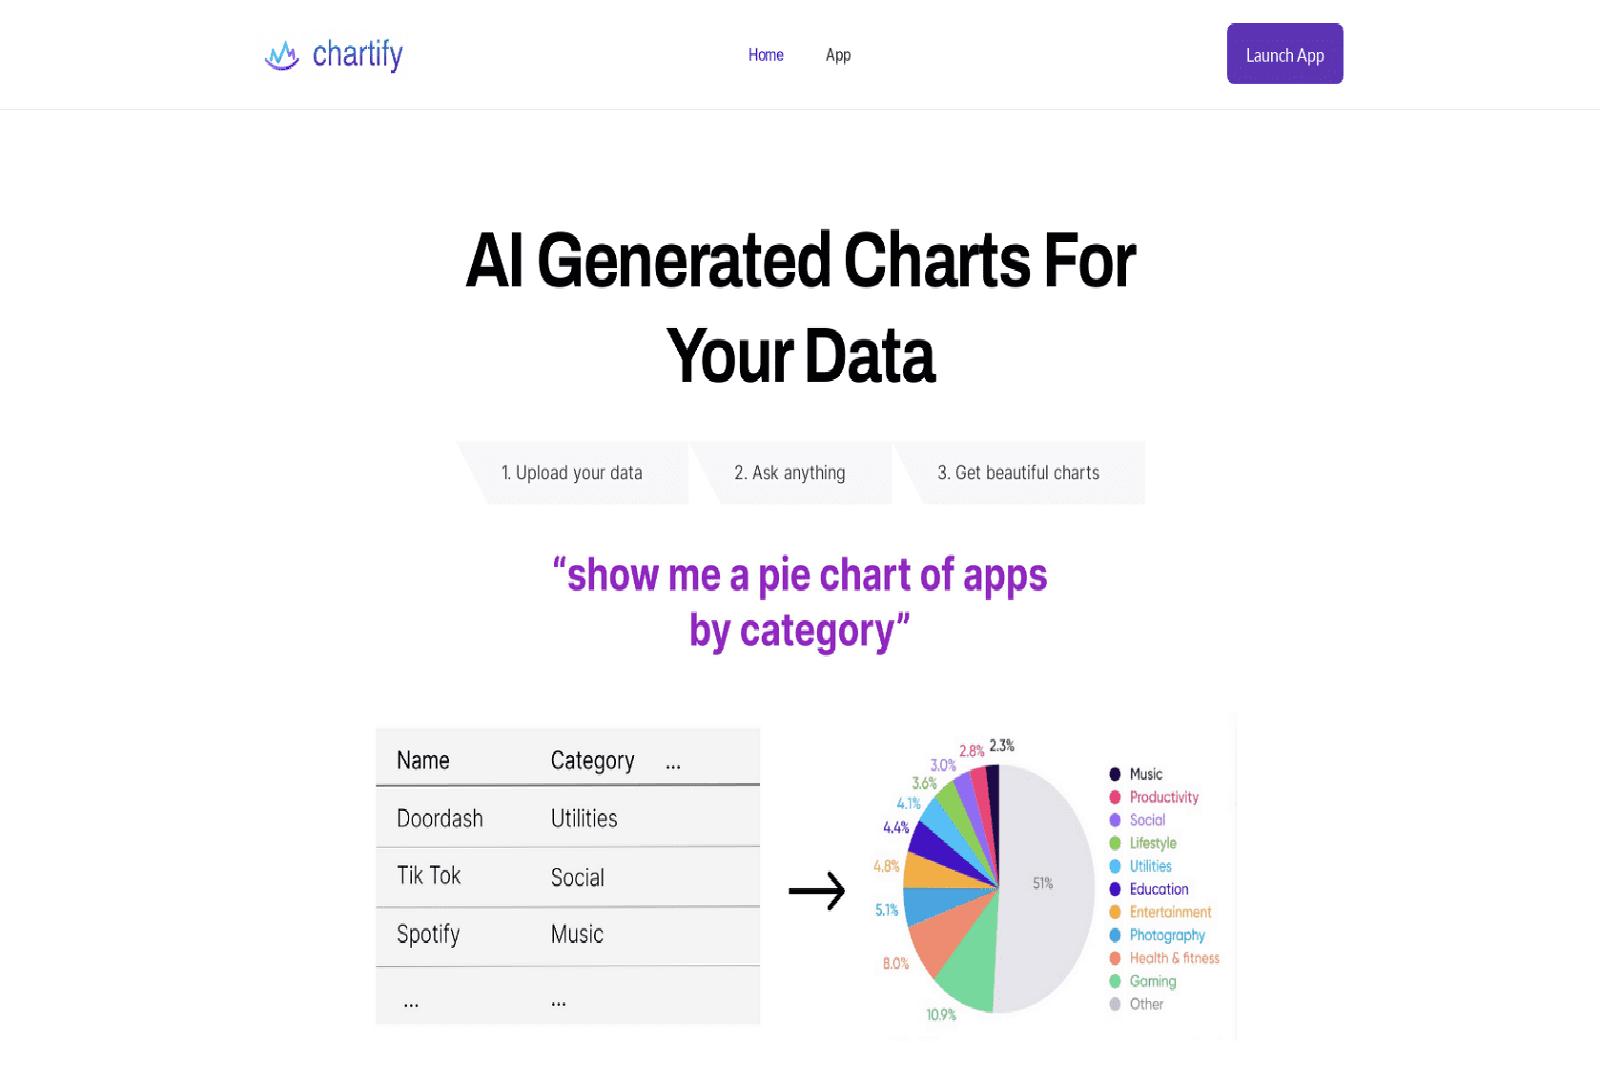

What is Chartify?
Chartify is an AI-powered tool that simplifies the process of creating interactive charts and graphs for data visualizations. With Chartify, users can quickly and easily upload their data, and the AI will recommend the most appropriate visualization types including pie charts, bar charts and line graphs.
Users also have the ability to request their preferred chart types, and the AI will generate them across Plotly, Matplotlib, Seaborn, and Charts.js frameworks. Chartify is perfect for any data analyst, business analyst, or researcher who needs to quickly generate visualizations for their data.
It's simple to use, time-saving, and provides a wide range of options for creating beautiful and informative visuals. With Chartify, users can turn their data into stunning visuals in no time.
Use Cases And Features
1. Generate interactive charts and graphs in Plotly, Matplotlib, Seaborn and Charts.js frameworks.
2. Quickly upload data and receive AI-recommended visualization types.
3. Request desired chart types and get beautiful and informative visuals.
Tool Website Engagement
Last Update: 2 years ago
- Disclaimer: Statistics sourced from third-party providers. Accuracy may fluctuate.
Total Monthly Visits: 4K
Bounce Rate: 91%
Visit Duration (avg): 2.60 seconds
Pages Per Visit: 1.06
Country Rank: 840
Global Rank: 6,955,729
Monthly Traffic
Traffic Sources
Traffic Share By Country
United States: 28.72%
India: 15.11%
United Kingdom: 9.87%
Canada: 8.98%
Australia: 6.61%