 OpenAI - ChatGPT, Sora
 Google - Gemini, Nano Banana
 Anthropic - Claude
 xAI - Grok
 Deepseek
 Alibaba - Qwen
 ByteDance - Doubao
 All Models
 Enterprise Plans
 AI Application Development
 AI Translator API
 AI SEO/GEO Service
 GEO-Optimized PR Service
 Web Scraping Service
 OpenClaw
 Top AI Tools
 Top AI Robots
 Log in

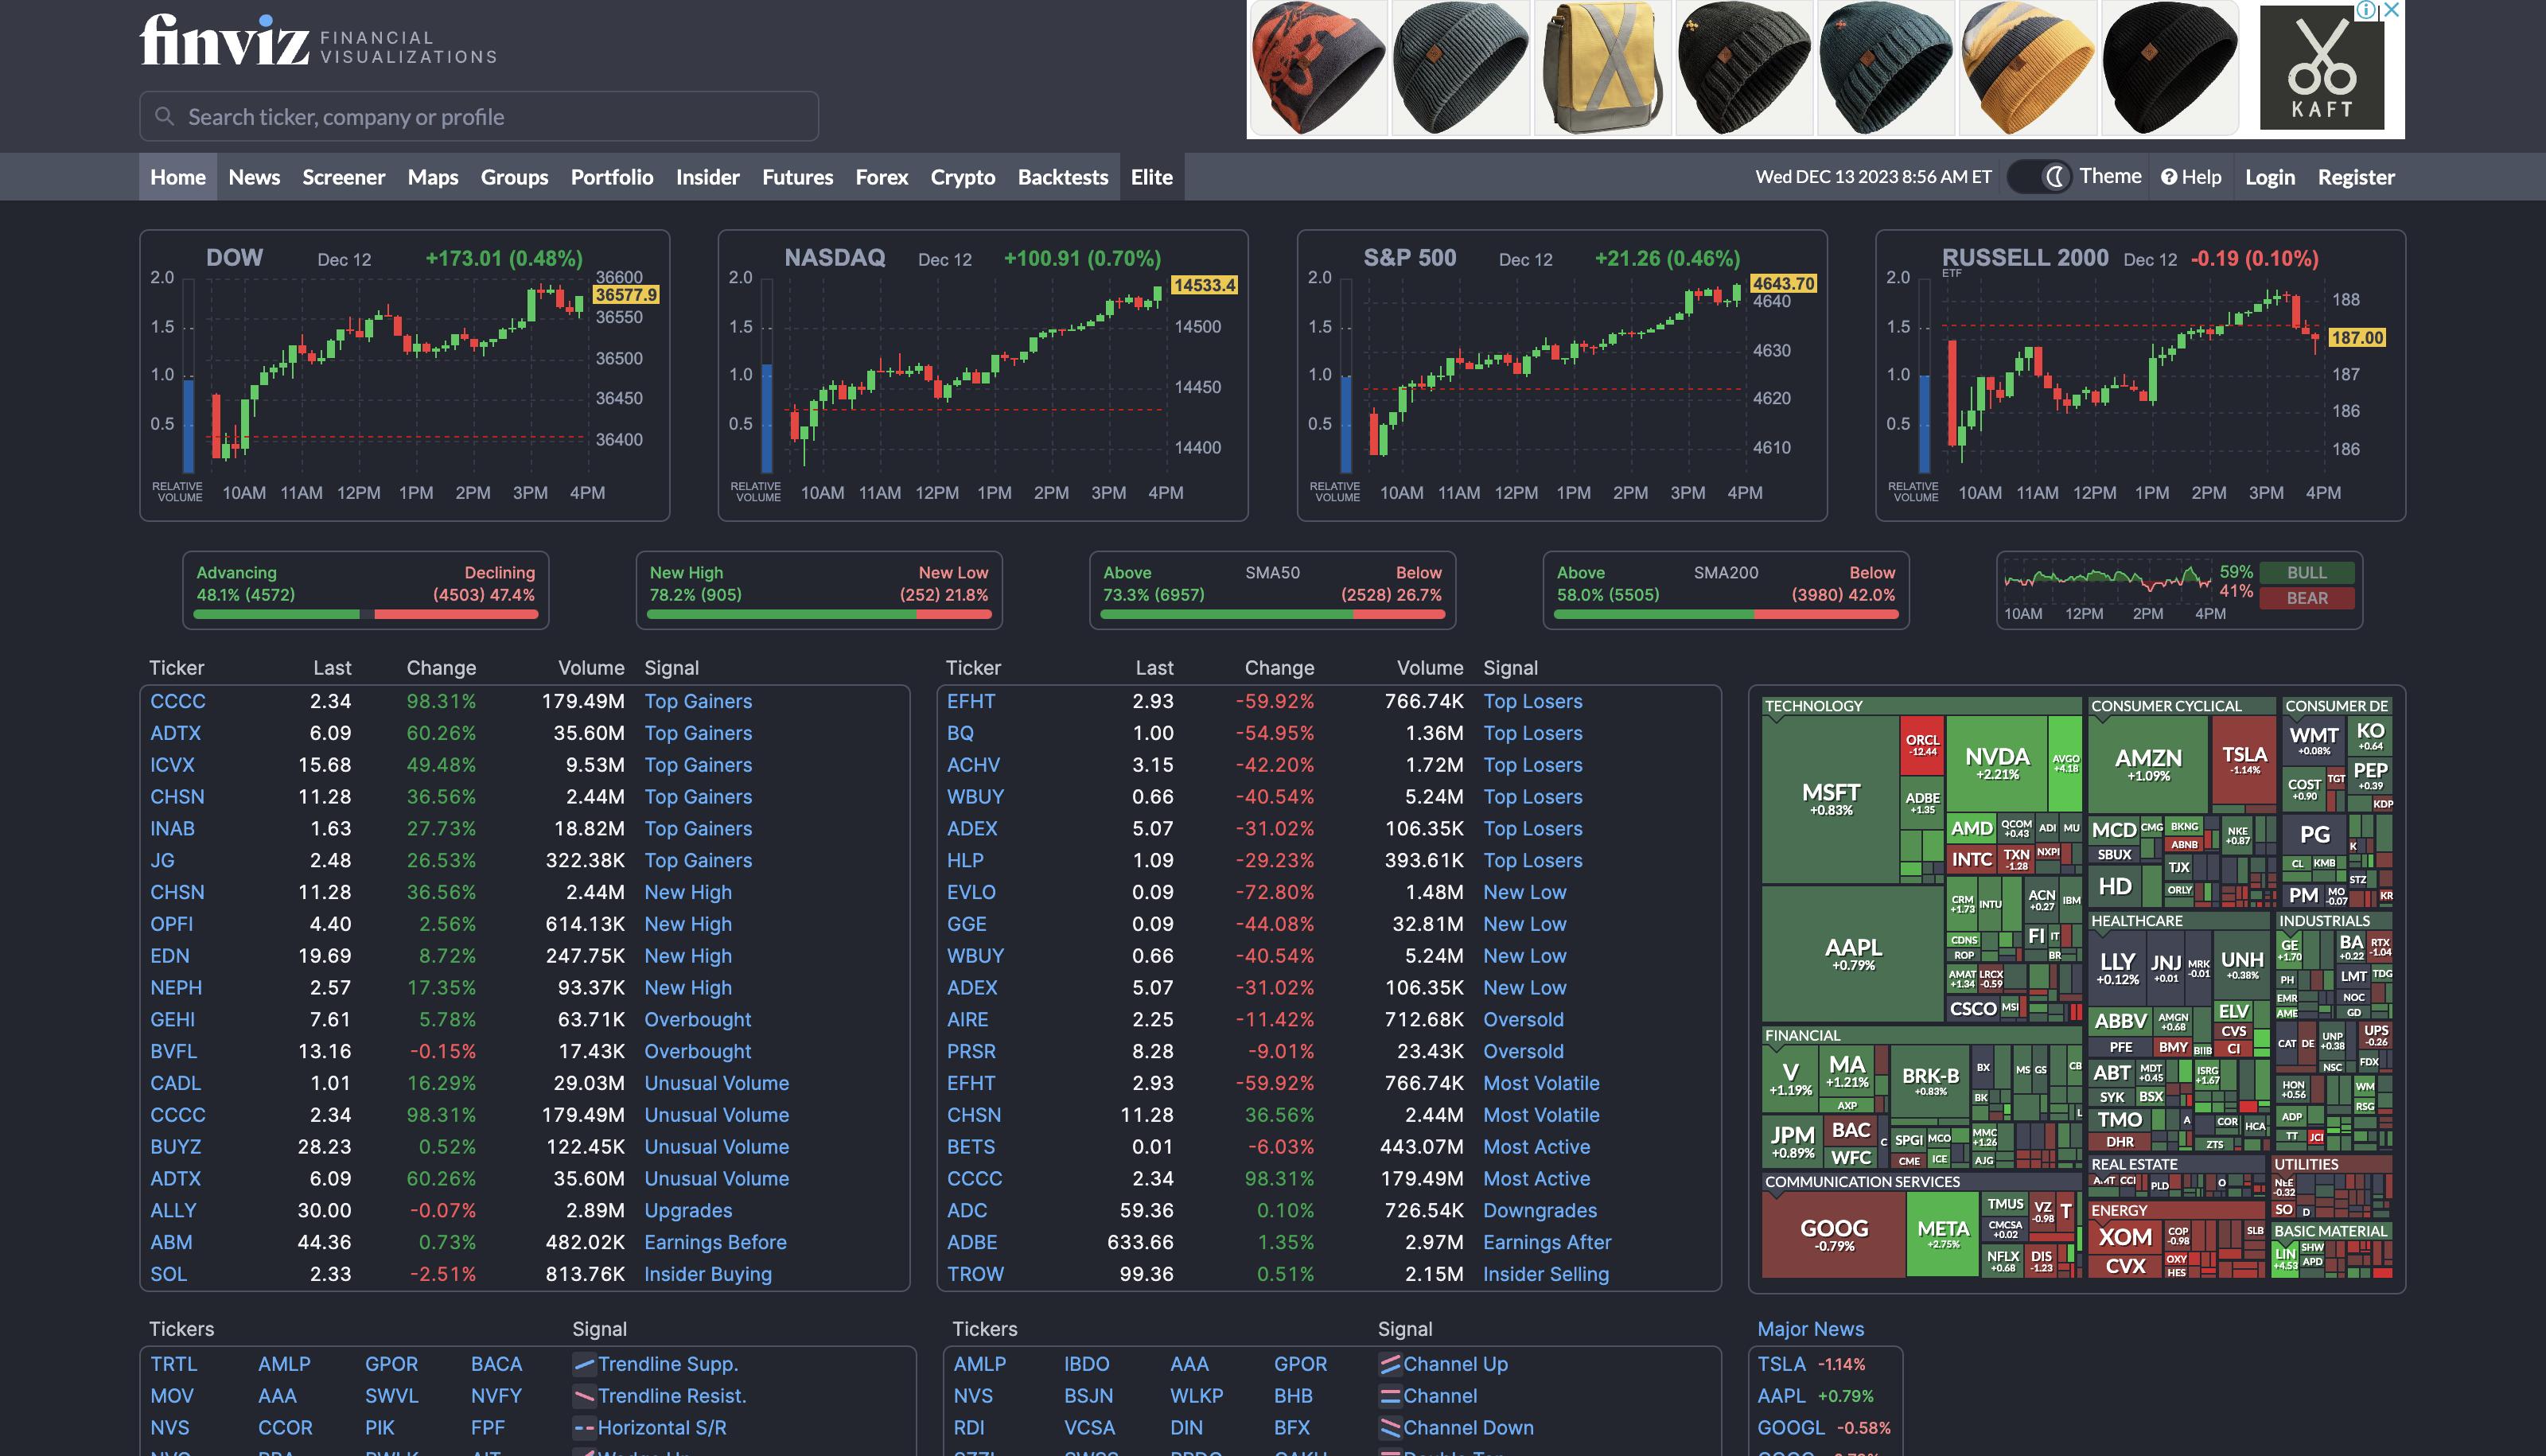

What is Finviz?
Finviz is the ultimate stock market data research tool designed to empower investors with powerful analytics and actionable insights. It provides comprehensive information on stocks, indices, currencies, and more, including real-time charts, news, and market analysis.
With Finviz, users can effectively monitor their portfolios, analyze market trends, and compare stocks side-by-side. The platform features an interactive heatmap that displays market performance at a glance, making it easier to identify opportunities and risks.
Whether you're a beginner or experienced trader, Finviz makes it simple to explore the stock market and stay on top of market movements. Its intuitive interface provides a wealth of accurate, up-to-date data to help users take control of their investments and track their success effectively.
Use Cases And Features
- Analyze stocks and indices with real-time charts and breaking news updates
- Monitor portfolios and compare stocks using an interactive heatmap visualization
- Track investment success and make informed decisions with comprehensive market analysis
Tool Website Engagement
Last Update: 2 years ago
Disclaimer: Statistics sourced from third-party providers. Accuracy may fluctuate.
Total Monthly Visits: 26M
Bounce Rate: 56%
Visit Duration (avg): 295.99 seconds
Pages Per Visit: 4.49
Country Rank: 840
Global Rank: 2,787
Monthly Traffic
Traffic Sources
Traffic Share By Country
- United States: 49.70%
- Canada: 6.93%
- Germany: 4.29%
- Korea, Republic of: 3.38%
- Japan: 3.08%