 OpenAI - ChatGPT, Sora
 Google - Gemini, Nano Banana
 Anthropic - Claude
 xAI - Grok
 Deepseek
 Alibaba - Qwen
 ByteDance - Doubao
 All Models
 Enterprise Plans
 AI Application Development
 AI Translator API
 AI SEO/GEO Service
 GEO-Optimized PR Service
 Web Scraping Service
 OpenClaw
 Top AI Tools
 Top AI Robots
 Log in

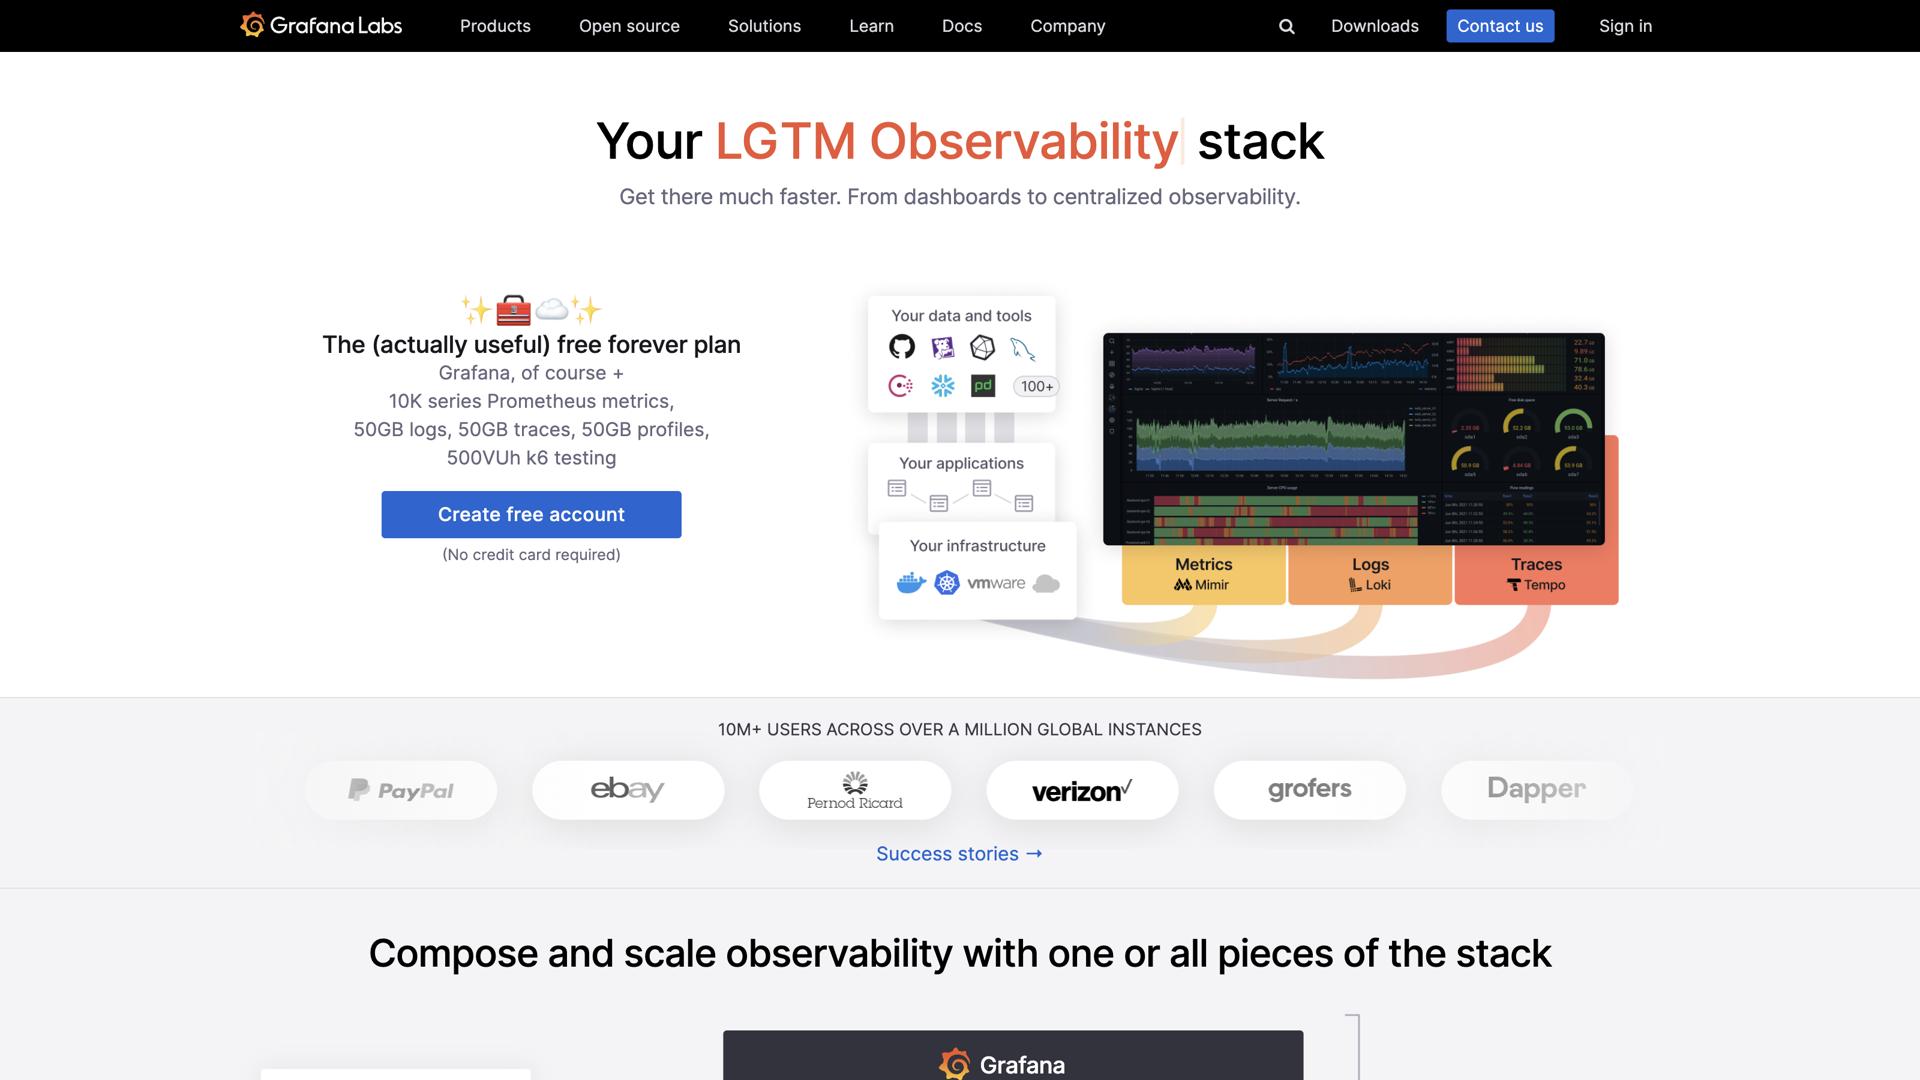

What is Grafana?
Grafana is an open source platform for analytics and monitoring that allows users to visualize data and track performance metrics. With Grafana, users can create dashboards and charts to quickly and easily monitor their applications, systems, and infrastructure.
Grafana offers powerful features that provide users with deep insights into their data, including advanced alerting and notifications, data source integration, and flexible customization options. With Grafana, users can monitor their data in real-time and quickly identify potential issues.
It's a great tool for developers, DevOps engineers, and IT professionals who need to stay on top of their applications and infrastructure. Grafana also provides a comprehensive set of APIs and SDKs, so users can easily integrate their data into Grafana and create custom visualizations. With Grafana, users can gain invaluable insights into their data and make informed decisions.
Use Cases And Features
1. Create visualizations and dashboards to quickly and easily monitor applications, systems, and infrastructure.
2. Utilize advanced alerting and notifications to stay on top of performance metrics.
3. Integrate data sources into Grafana and create custom visualizations.
Tool Website Engagement
Last Update: 2 years ago
Disclaimer: Statistics sourced from third-party providers. Accuracy may fluctuate.
Total Monthly Visits: 2M
Bounce Rate: 47%
Visit Duration (avg): 266.29 seconds
Pages Per Visit: 4.26
Country Rank: 840
Global Rank: 33,055
Monthly Traffic
Traffic Sources
Traffic Share By Country
United States: 13.93%
India: 8.25%
Germany: 6.49%
China: 5.15%
Russia: 4.83%