 OpenAI - ChatGPT, Sora
 Google - Gemini, Nano Banana
 Anthropic - Claude
 xAI - Grok
 Deepseek
 Alibaba - Qwen
 ByteDance - Doubao
 All Models
 Enterprise Plans
 AI Application Development
 AI Translator API
 AI SEO/GEO Service
 GEO-Optimized PR Service
 Web Scraping Service
 OpenClaw
 Top AI Tools
 Top AI Robots
 Log in

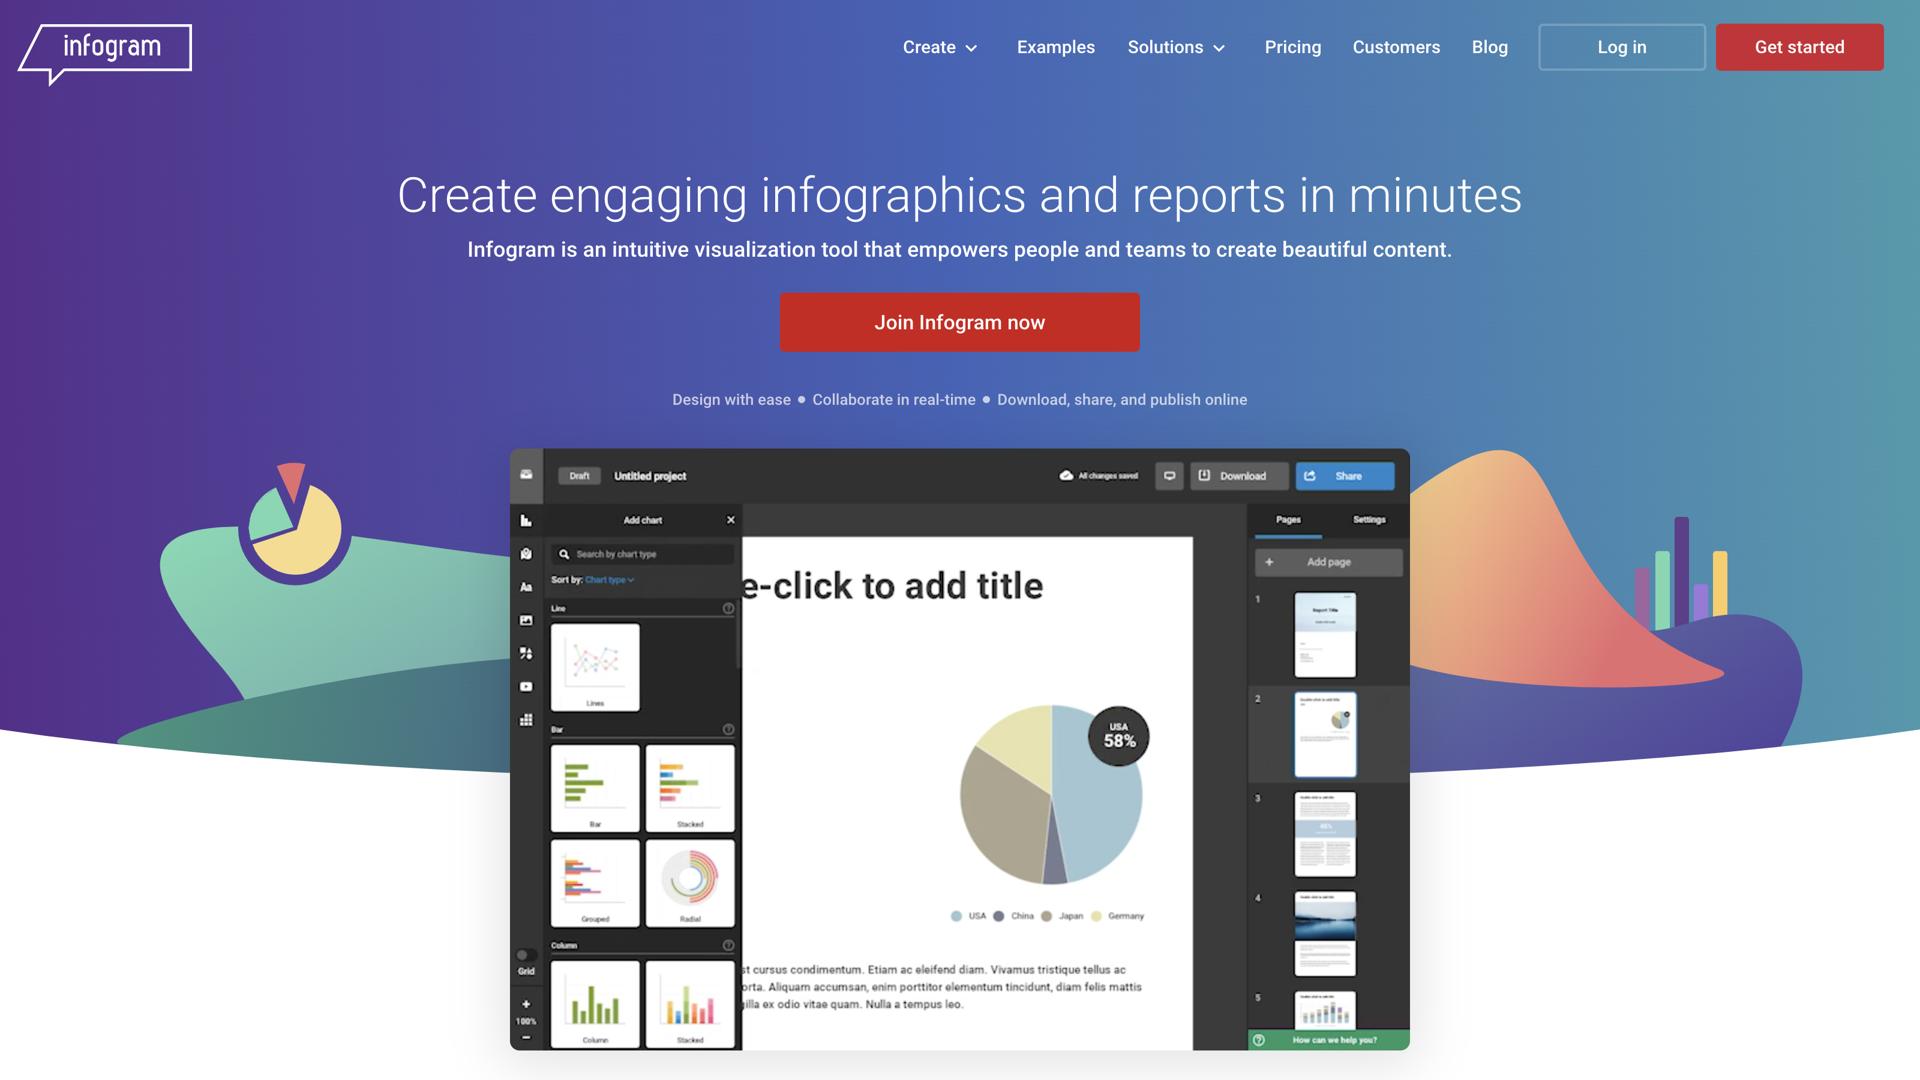

What is Infogram?
Infogram is a powerful yet easy-to-use data visualization platform designed to help individuals, businesses, and organizations create beautiful, interactive charts and graphs from their data. With Infogram, you can quickly transform raw data into eye-catching visuals, ranging from simple bar and pie charts to more complex maps and timelines.
You can also create interactive infographics, embed them on websites and social media platforms, and share them with your audience seamlessly. With a variety of customization options and an intuitive drag-and-drop interface, Infogram makes it effortless to create stunning visuals that engage and inform your viewers.
The platform is also cloud-based, allowing you to access your data and visuals from anywhere and collaborate with your team in real time. Infogram is the perfect solution for anyone who wants to make their data more engaging and impactful.
Use Cases And Features
- Create stunning visuals to engage viewers
- Transform data into eye-catching visuals
- Collaborate with team in real-time
Tool Website Engagement
Last Update: 2 years ago
Disclaimer: Statistics sourced from third-party providers. Accuracy may fluctuate.
Total Monthly Visits: 1M
Bounce Rate: 59%
Visit Duration (avg): 143.58 seconds
Pages Per Visit: 2.89
Country Rank: 840
Global Rank: 58,719
Monthly Traffic
Traffic Sources
Traffic Share By Country
- United States: 17.49%
- Mexico: 9.12%
- Colombia: 7.78%
- Brazil: 6.40%
- France: 3.59%