 OpenAI - ChatGPT, Sora
 Google - Gemini, Nano Banana
 Anthropic - Claude
 xAI - Grok
 Deepseek
 Alibaba - Qwen
 ByteDance - Doubao
 All Models
 Enterprise Plans
 AI Application Development
 AI Translator API
 AI SEO/GEO Service
 GEO-Optimized PR Service
 Web Scraping Service
 OpenClaw
 Top AI Tools
 Top AI Robots
 Log in

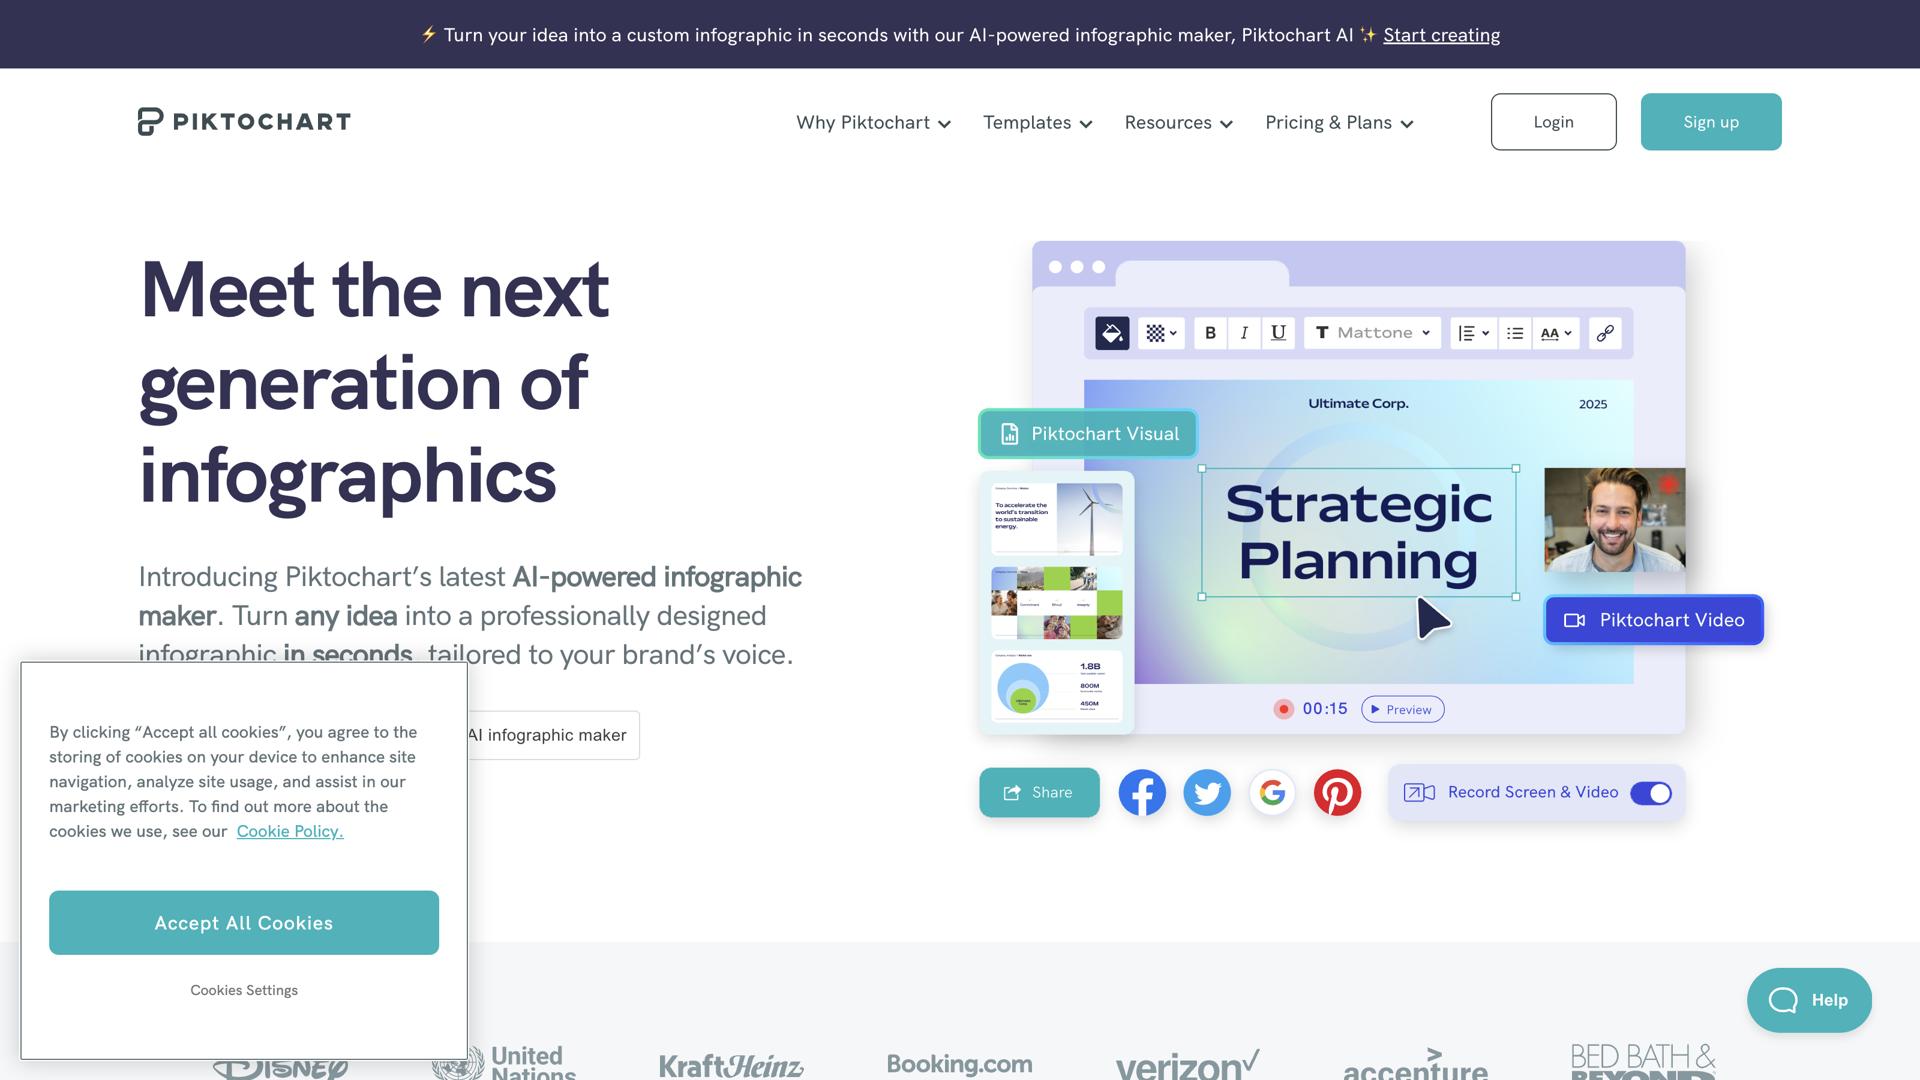

What is Piktochart?
Piktochart is an easy-to-use, yet powerful tool for creating beautiful and professional-looking visuals. Whether you are a beginner or a seasoned designer, Piktochart empowers you to express your ideas with stunning visuals, charts, graphs, and diagrams. With a comprehensive library of high-quality templates, icons, and illustrations, you can easily create stunning infographics, reports, presentations, and data visualizations.
With the intuitive drag-and-drop editor, you can customize your design with ease, and the powerful analytics feature enables you to track the performance of your visuals. With Piktochart, you can quickly and easily create visuals that will get you noticed, engage your audience, and make your message stand out.
Use Cases And Features
1. Create stunning infographics for social media.
2. Design presentations to engage clients.
3. Generate professional-looking reports with analytics.
Tool Website Engagement
Last Update: 2 years ago
Disclaimer: Statistics sourced from third-party providers. Accuracy may fluctuate.
Total Monthly Visits: 1M
Bounce Rate: 49%
Visit Duration (avg): 208.74 seconds
Pages Per Visit: 3.84
Country Rank: 840
Global Rank: 46,003
Monthly Traffic
Traffic Sources
Traffic Share By Country
United States: 22.31%
Mexico: 10.04%
India: 7.68%
Colombia: 4.89%
Canada: 3.94%