 OpenAI - ChatGPT, Sora
 Google - Gemini, Nano Banana
 Anthropic - Claude
 xAI - Grok
 Deepseek
 Alibaba - Qwen
 ByteDance - Doubao
 All Models
 Enterprise Plans
 AI Application Development
 AI Translator API
 AI SEO/GEO Service
 GEO-Optimized PR Service
 Web Scraping Service
 OpenClaw
 Top AI Tools
 Top AI Robots
 Log in

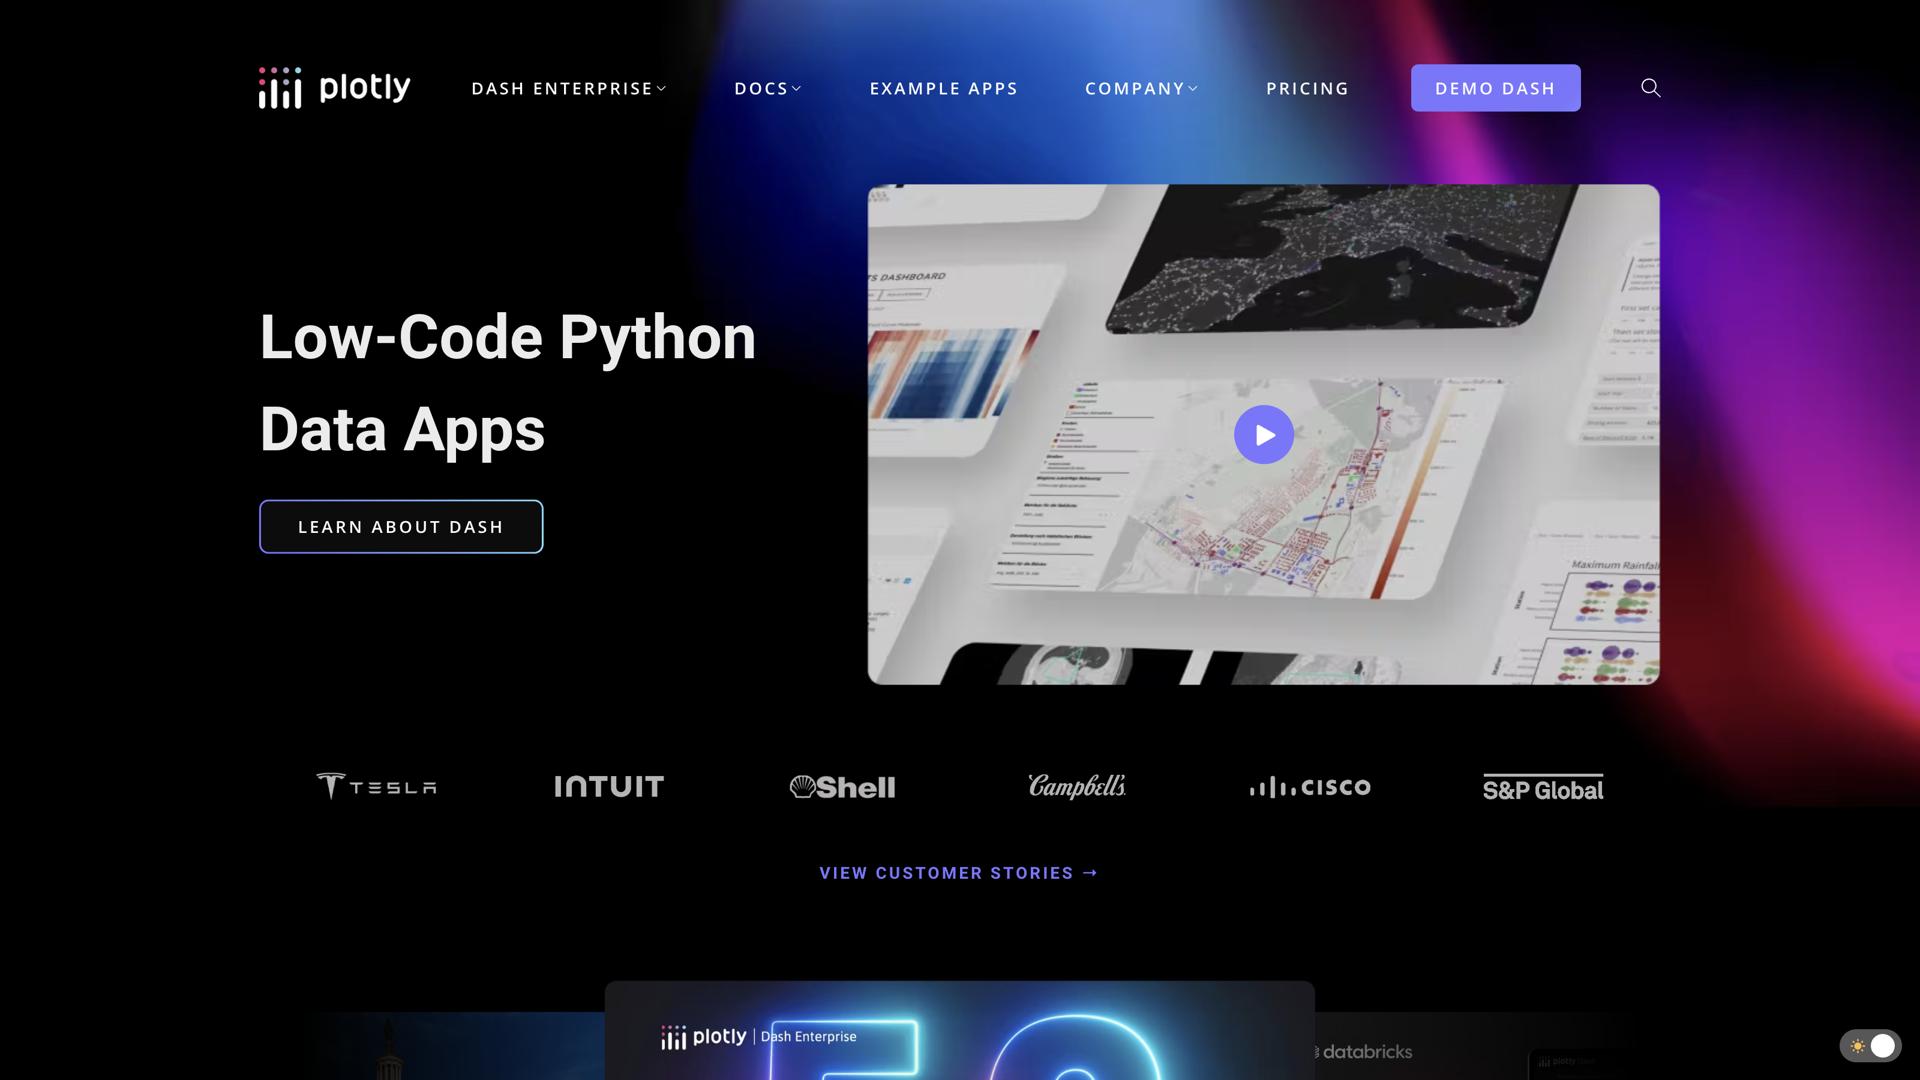

What is Plotly?
Plotly is a powerful data visualization platform that enables users to explore and analyze their data in real time. With Plotly, users can create beautiful, interactive charts and graphs, transforming complex datasets into actionable insights. It features a drag-and-drop interface, allowing users to quickly generate stunning visuals without any coding knowledge.
Additionally, Plotly offers a range of customization options to further enhance graphics, such as customizing the look and feel of graphs, adding annotations, and incorporating interactive elements. With Plotly, users can easily and quickly make their data more meaningful and presentable.
It also allows users to share their data and visualizations with others, making it ideal for collaboration. Whether you're a data analyst, a business executive, or a student, Plotly can help you make sense of your data and communicate it to others in a compelling and engaging way.
Use Cases And Features
- Create interactive charts and graphs in seconds with Plotly's drag-and-drop interface.
- Customize visuals with a range of options for further enhancing graphs.
- Easily share data and visualizations with others for collaboration.
Tool Website Engagement
Last Update: 2 years ago
Disclaimer: Statistics sourced from third-party providers. Accuracy may fluctuate.
Total Monthly Visits: 44K
Bounce Rate: 54%
Visit Duration (avg): 195.52 seconds
Pages Per Visit: 2.48
Country Rank: 840
Global Rank: 832,661
Monthly Traffic
Traffic Sources
Traffic Share By Country
- United States: 24.62%
- United Kingdom: 5.26%
- India: 3.77%
- Canada: 3.12%
- China: 3.03%