 OpenAI - ChatGPT, Sora
 Google - Gemini, Nano Banana
 Anthropic - Claude
 xAI - Grok
 Deepseek
 Alibaba - Qwen
 ByteDance - Doubao
 All Models
 Enterprise Plans
 AI Application Development
 AI Translator API
 AI SEO/GEO Service
 GEO-Optimized PR Service
 Web Scraping Service
 OpenClaw
 Top AI Tools
 Top AI Robots
 Log in

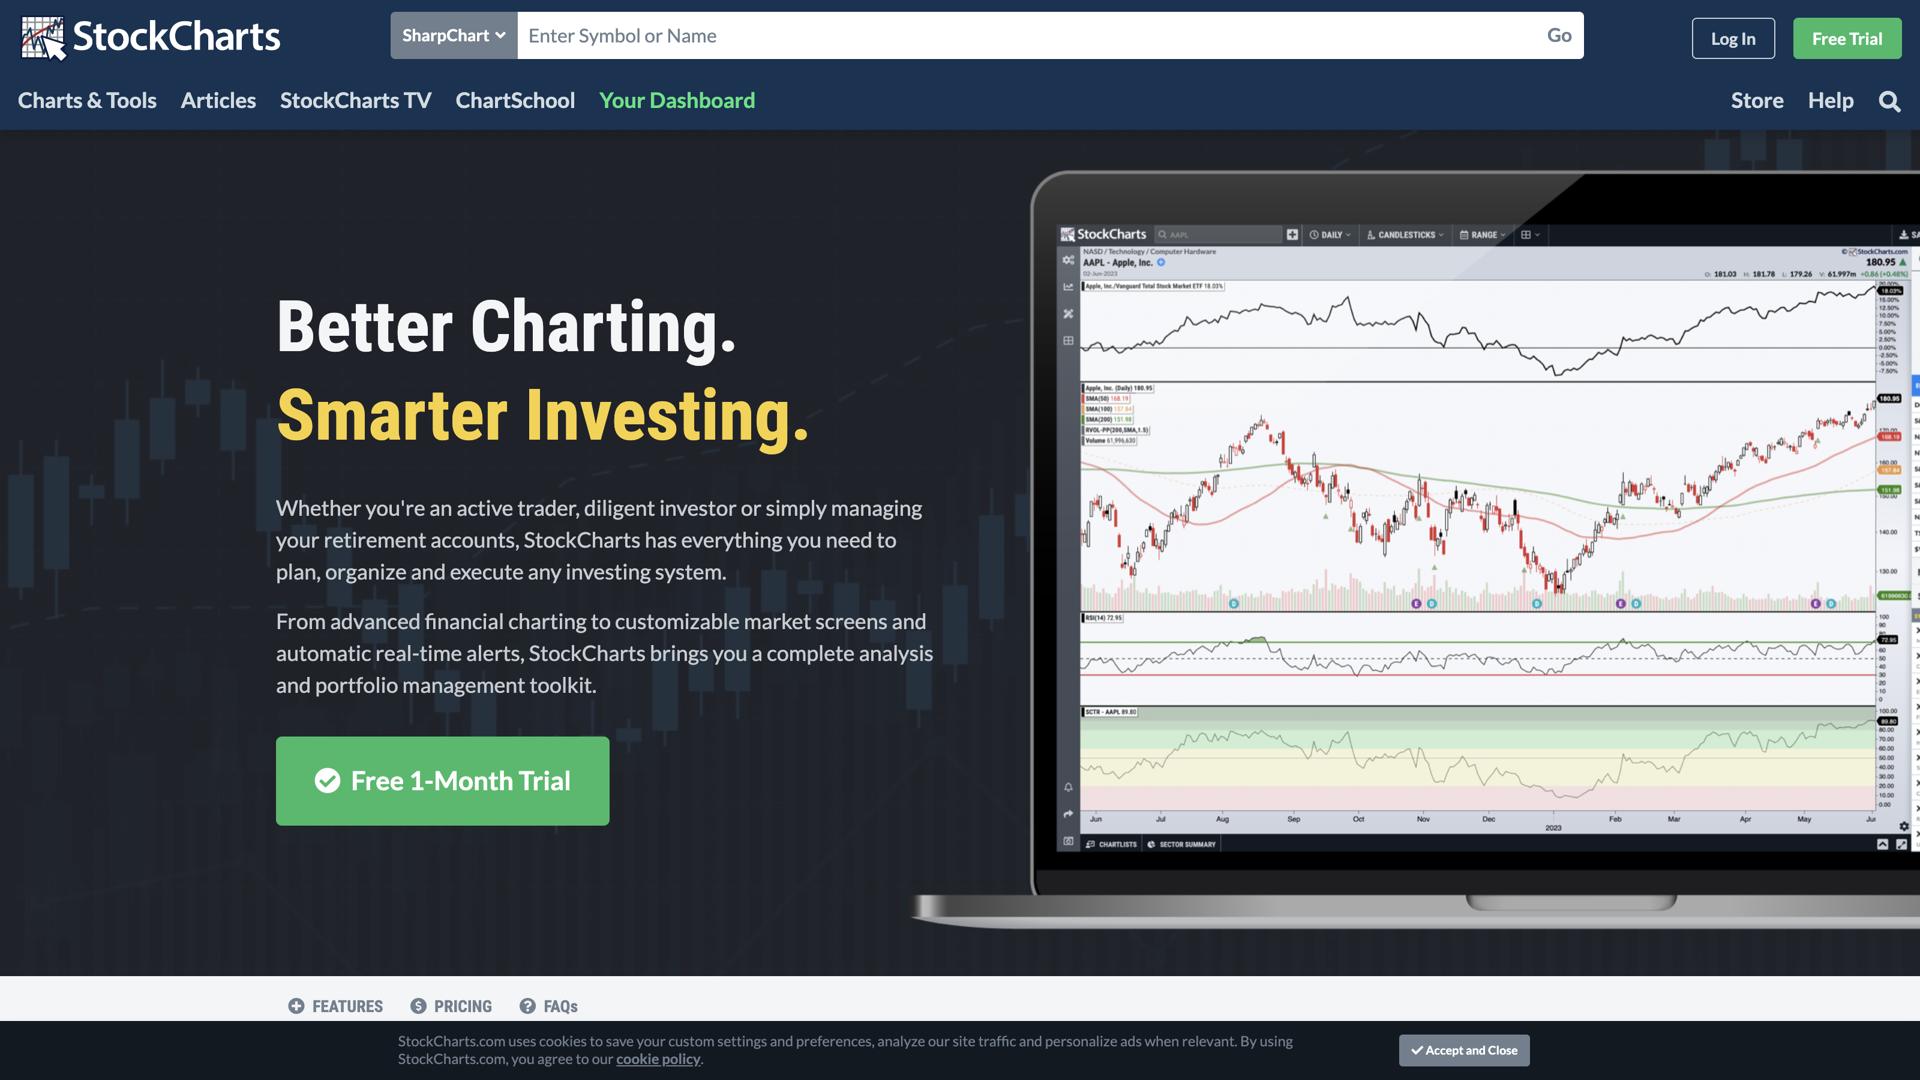

What is StockCharts?
StockCharts is an online platform that provides traders, investors, and analysts with the tools they need to make informed decisions about the stock market. With StockCharts, users can access up-to-date market data and charting capabilities that make tracking and analyzing stock prices easier than ever.
The platform's advanced charting tools allow users to track real-time stock movements, create custom technical indicators, and compare stock prices over different periods of time. StockCharts also offers access to real-time market news, financial data, and over 30 years of historical stock data to provide users with a comprehensive view of the stock market.
Additionally, StockCharts includes a number of educational materials, such as tutorials and webinars, that can help users refine their trading techniques and become more successful investors. With its powerful tools, comprehensive data, and educational resources, StockCharts is an invaluable resource for anyone looking to stay up-to-date on the stock market.
Use Cases And Features
1. Track real-time stock movements.
2. Create custom technical indicators.
3. Access comprehensive market data.
Tool Website Engagement
Last Update: 2 years ago
Disclaimer: Statistics sourced from third-party providers. Accuracy may fluctuate.
Total Monthly Visits: 6M
Bounce Rate: 32%
Visit Duration (avg): 582.59 seconds
Pages Per Visit: 8.80
Country Rank: 840
Global Rank: 8,674