 OpenAI - ChatGPT, Sora
 Google - Gemini, Nano Banana
 Anthropic - Claude
 xAI - Grok
 Deepseek
 Alibaba - Qwen
 ByteDance - Doubao
 All Models
 Enterprise Plans
 AI Application Development
 AI Translator API
 AI SEO/GEO Service
 GEO-Optimized PR Service
 Web Scraping Service
 OpenClaw
 Top AI Tools
 Top AI Robots
 Log in

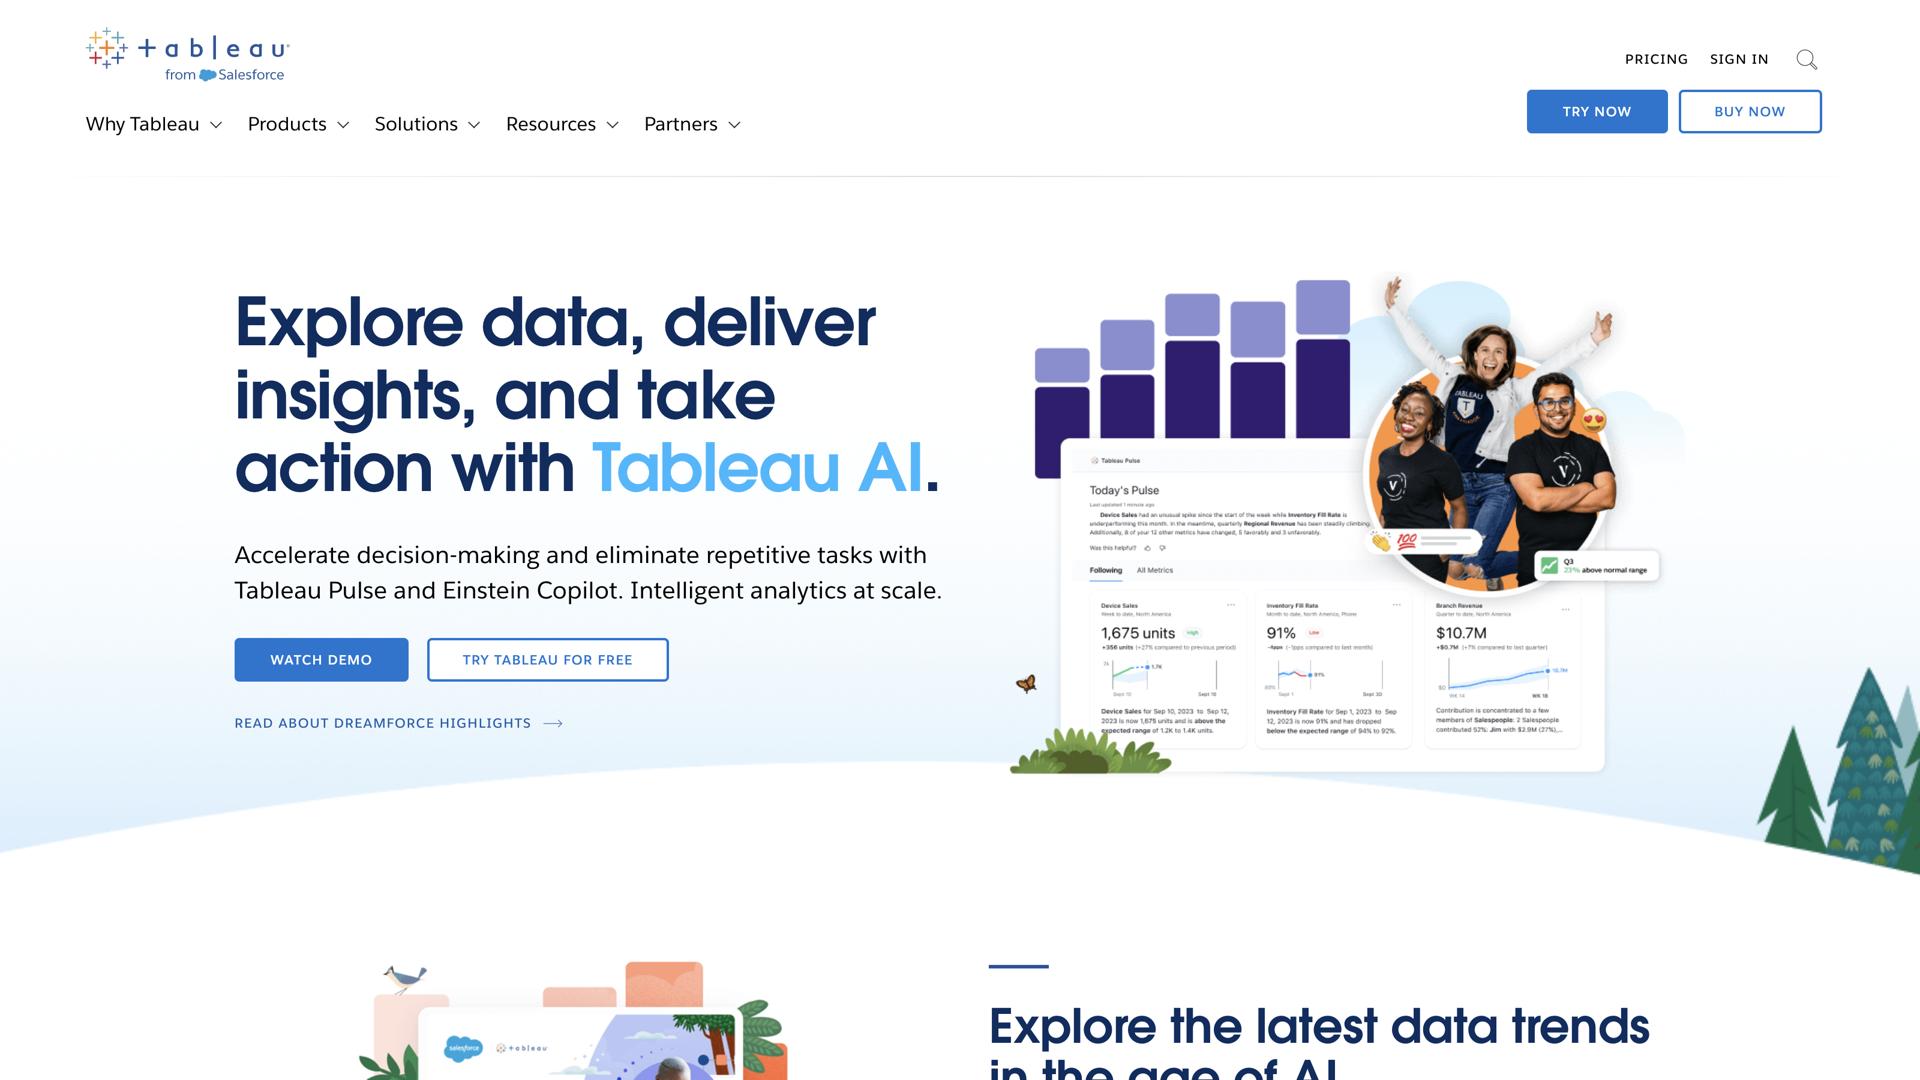

What is Tableau?
Tableau is a powerful business intelligence and data analytics platform designed to help companies make informed decisions by transforming raw data into actionable insights. With Tableau, users can quickly visualize and explore their data, build interactive dashboards, and share insights with stakeholders across the organization.
Tableau's intuitive drag-and-drop interface makes it easy to create visualizations from any data source in minutes, without writing a single line of code. Its advanced analytics capabilities enable users to analyze data at any level of detail, while its collaboration features enable teams to work together on projects in real-time.
Tableau is the perfect tool for data-driven organizations looking to make better decisions, faster. Users can quickly analyze their data, uncover hidden trends, and create compelling visualizations to share with their team. It's the ideal solution for any business looking to make faster, smarter decisions.
Use Cases And Features
- Analyze data at any level of detail – Dive deep into your datasets to uncover insights
- Create interactive dashboards – Build dynamic visualizations that engage stakeholders
- Share insights with stakeholders – Collaborate and communicate findings across teams
Tool Website Engagement
Last Update: 2 years ago
Disclaimer: Statistics sourced from third-party providers. Accuracy may fluctuate.
Total Monthly Visits: 9M
Bounce Rate: 39%
Visit Duration (avg): 356.18 seconds
Pages Per Visit: 7.09
Country Rank: 840
Global Rank: 5,502
Monthly Traffic
Traffic Sources
Traffic Share By Country
- United States: 38.46%
- India: 6.78%
- Japan: 6.49%
- United Kingdom: 4.66%
- Canada: 2.80%