 OpenAI - ChatGPT, Sora
 Google - Gemini, Nano Banana
 Anthropic - Claude
 xAI - Grok
 Deepseek
 Alibaba - Qwen
 ByteDance - Doubao
 All Models
 Enterprise Plans
 AI Application Development
 AI Translator API
 AI SEO/GEO Service
 GEO-Optimized PR Service
 Web Scraping Service
 OpenClaw
 Top AI Tools
 Top AI Robots
 Log in

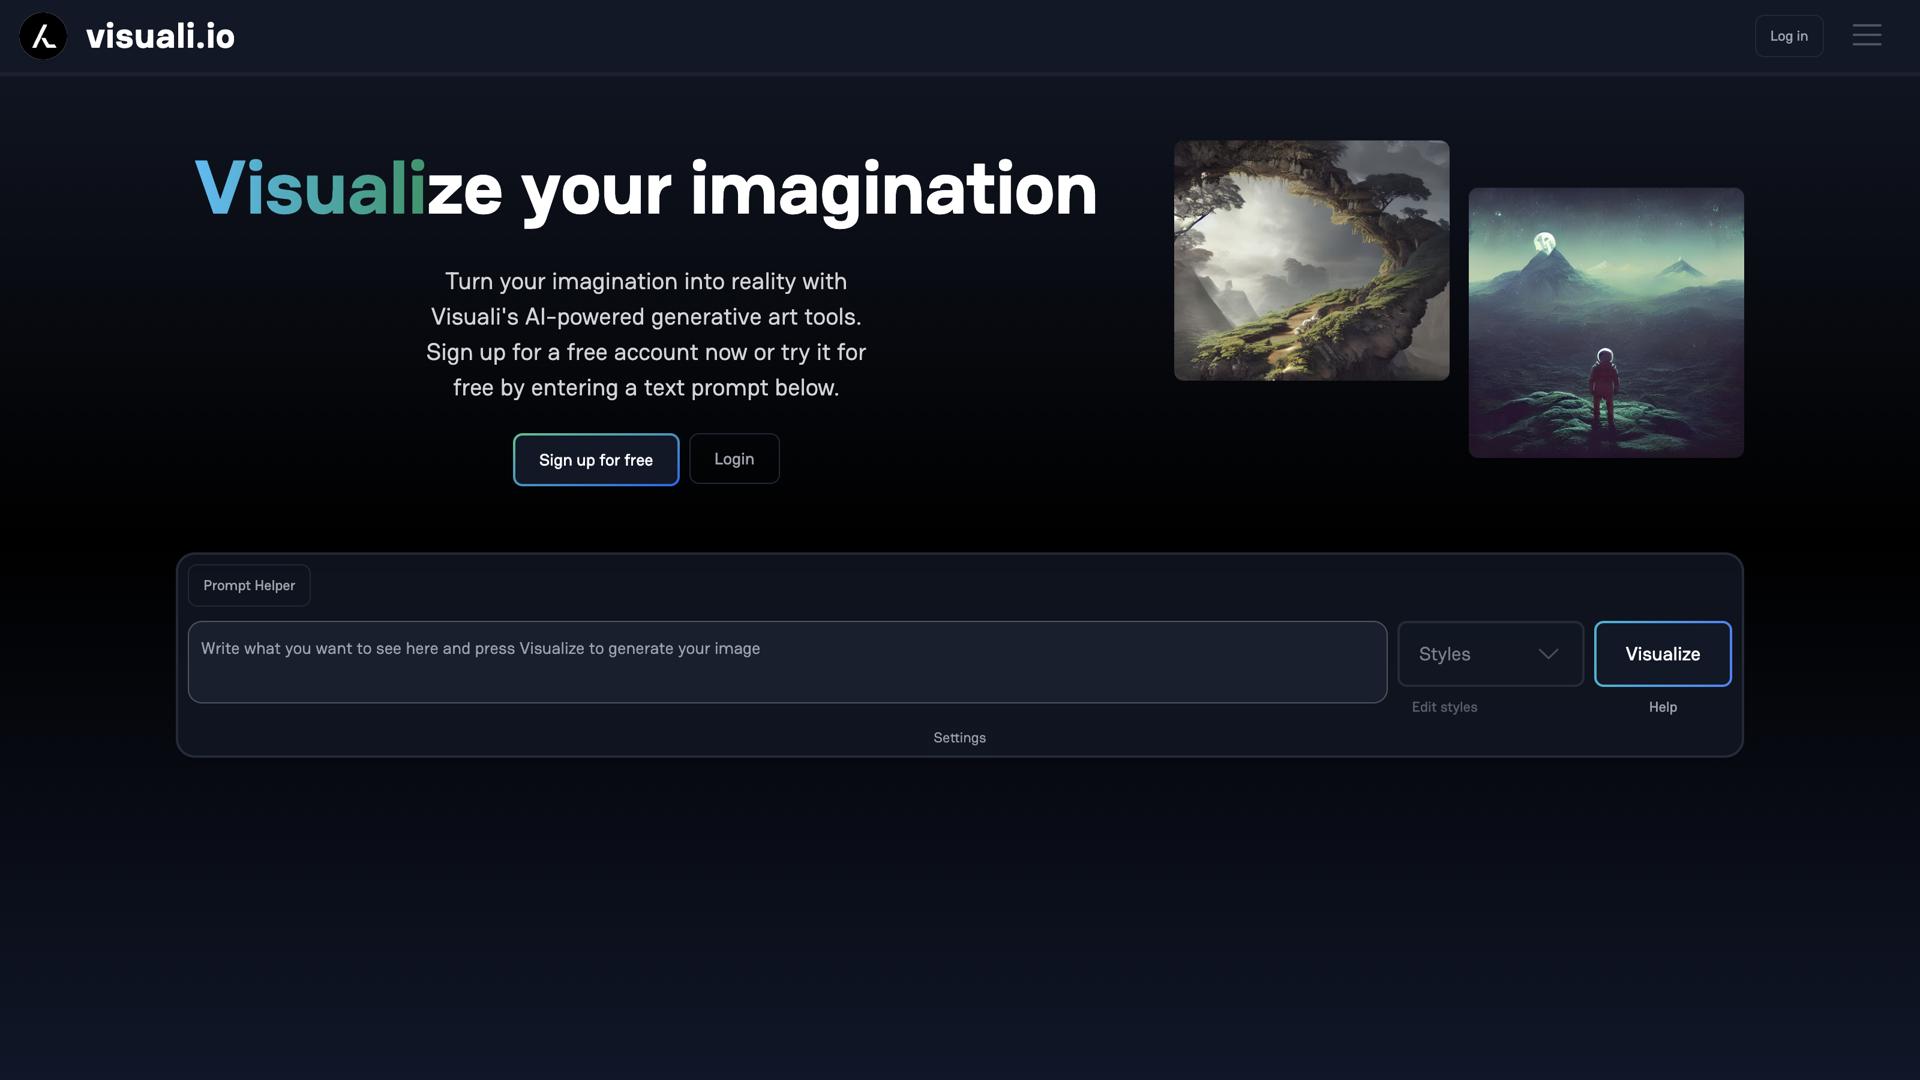

What is Visuali?
VisualiX is a powerful and easy-to-use data visualization tool designed to help users quickly and easily create stunning visuals. With VisualiX, you can visualize your data in a variety of ways, including charts, graphs, tables, and maps. VisualiX also offers advanced features, such as the ability to create interactive dashboards and custom visuals.
Whether you are a beginner or an experienced data visualization professional, VisualiX can help you quickly and easily create beautiful visuals that will help you communicate your message clearly and effectively. With VisualiX, you can transform complex data into easy-to-understand visuals, helping you to make informed decisions and tell powerful stories.
With its intuitive and user-friendly interface, VisualiX makes data visualization a breeze, allowing you to focus on the task at hand and achieve the results you need.
Use Cases And Features
- Quickly create stunning visuals
- Create interactive dashboards
- Transform complex data into easy-to-understand visuals
Tool Website Engagement
Last Update: 2 years ago
Disclaimer: Statistics sourced from third-party providers. Accuracy may fluctuate.
Total Monthly Visits: 4K
Bounce Rate: 25%
Visit Duration (avg): 175.28 seconds
Pages Per Visit: 1.90
Country Rank: 840
Global Rank: 5,705,580
Monthly Traffic
Traffic Sources
Traffic Share By Country
- United States: 19.06%
- Malaysia: 17.24%
- India: 11.68%
- Turkey: 11.51%
- Germany: 9.74%