 OpenAI - ChatGPT, Sora
 Google - Gemini, Nano Banana
 Anthropic - Claude
 xAI - Grok
 Deepseek
 Alibaba - Qwen
 ByteDance - Doubao
 All Models
 Enterprise Plans
 AI Application Development
 AI Translator API
 AI SEO/GEO Service
 GEO-Optimized PR Service
 Web Scraping Service
 OpenClaw
 Top AI Tools
 Top AI Robots
 Log in


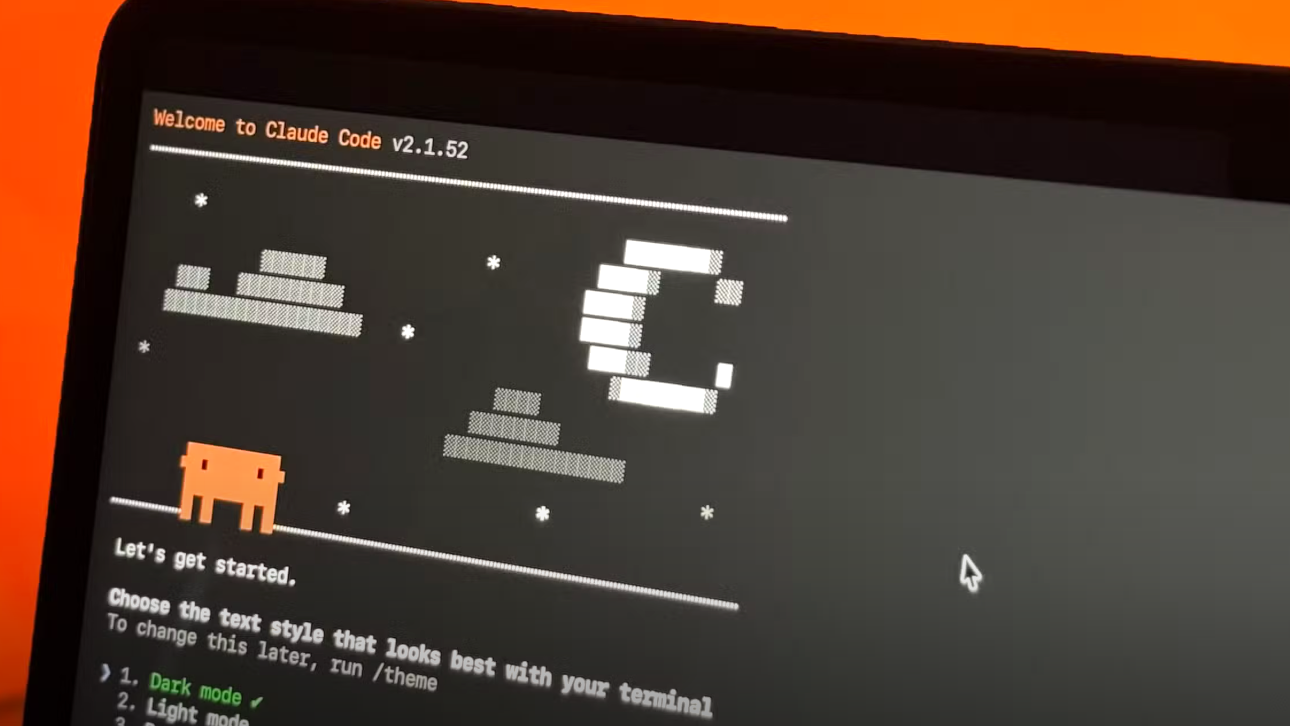
Claude Code Monitor 2026 Tutorial: Official OpenTelemetry Setup for Real-Time Token, Cost & Background Task Tracking
Source: Anthropic Official Docs
Claude Code Monitor:
OpenTelemetry
Anthropic just made Claude Code far more production-ready with native OpenTelemetry (OTel) support for monitoring. Whether you're running long-running autonomous agents, background tasks in Auto Mode, or enterprise-scale coding workflows, the new official monitoring capabilities let you track token consumption, estimated costs, tool activity, and session health in real time — without relying on scattered community tools.
What Is Claude Code Monitor?
Claude Code now exports rich telemetry data out of the box through OpenTelemetry — the official, vendor-neutral way to monitor everything your agentic coding sessions produce.
- Token usage (input, output, cache creation, cache read)
- Cost estimates (real-time and predictive)
- Tool activity (file edits, command execution, git operations, browser use)
- Background tasks & persistent sessions (
/tasks, long-running agents) - Productivity metrics (accepted code lines, suggestion acceptance rate)
Unlike earlier local JSONL-based community dashboards, official OTel support gives you enterprise-grade observability with zero custom code. Claude Code agents now run for hours or days autonomously — without monitoring, you risk surprise bills, lost progress, or rate-limit surprises.
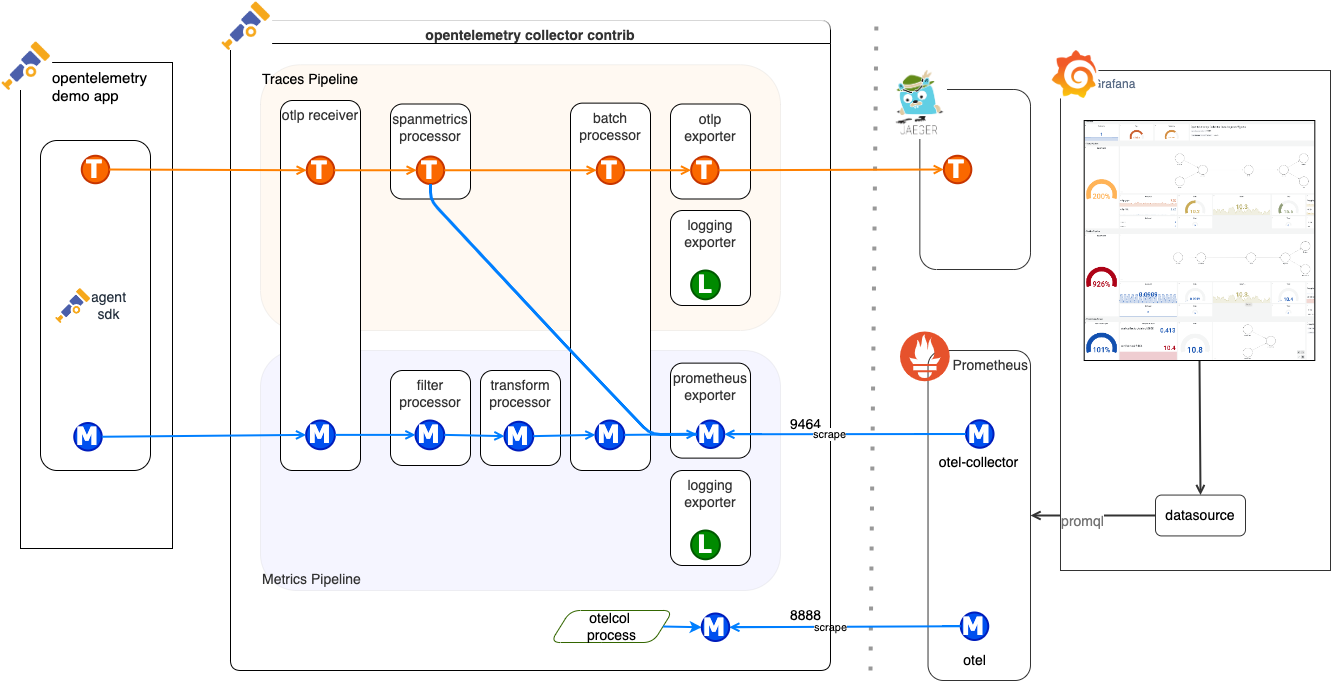
// OpenTelemetry Collector data flow — the backbone of Claude Code's official monitoring architecture
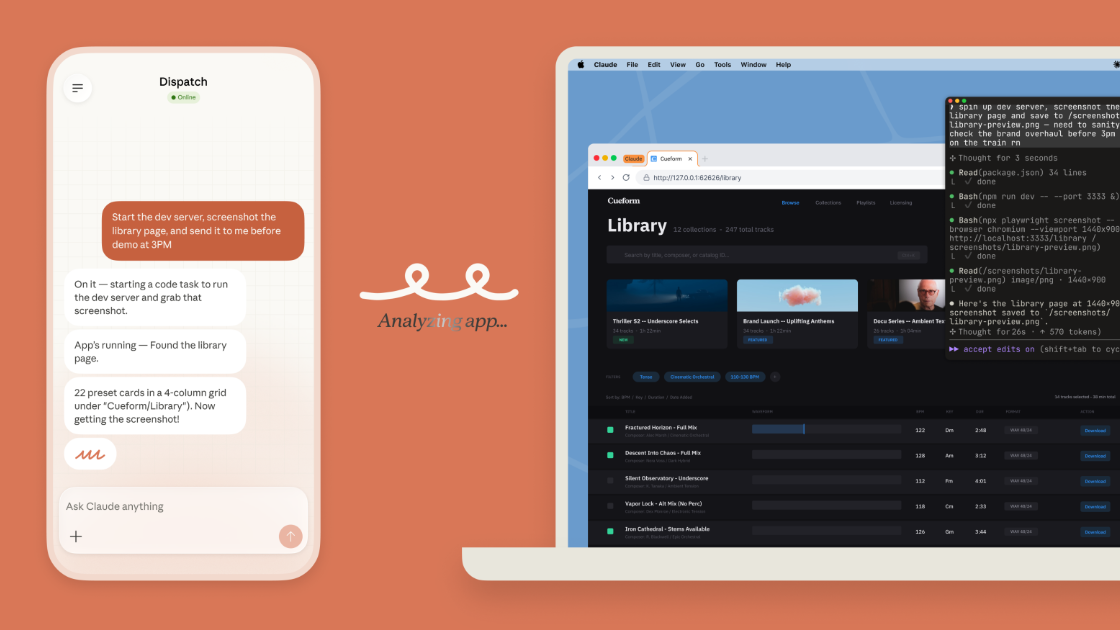
// Real-time Claude Code session monitor (terminal + multi-session view)
Step-by-Step Setup Guide
Step 01 — Enable Telemetry in Claude CodeLaunch Claude Code with these environment variables. Add to your ~/.zshrc or ~/.bashrc for permanence:
export CLAUDE_CODE_ENABLE_TELEMETRY=1 export OTEL_METRICS_EXPORTER=otlp export OTEL_LOGS_EXPORTER=otlp export OTEL_TRACES_EXPORTER=otlp export OTEL_EXPORTER_OTLP_ENDPOINT=http://localhost:4317 # Point to your Collector export OTEL_EXPORTER_OTLP_PROTOCOL=grpc export OTEL_METRIC_EXPORT_INTERVAL=10000 # 10 seconds for real-time feel
Restart your terminal and run claude — telemetry will now stream automatically.
Create a project folder and this docker-compose.yml:
version: '3.8' services: otel-collector: image: otel/opentelemetry-collector-contrib:latest command: ["--config", "/etc/otel/config.yaml"] volumes: - ./otel-config.yaml:/etc/otel/config.yaml ports: - "4317:4317" # gRPC - "4318:4318" # HTTP depends_on: - prometheus prometheus: image: prom/prometheus:latest ports: - "9090:9090" volumes: - ./prometheus.yml:/etc/prometheus/prometheus.yml grafana: image: grafana/grafana:latest ports: - "3000:3000" environment: - GF_SECURITY_ADMIN_PASSWORD=admin depends_on: - prometheus
otel-config.yaml (minimal but powerful):
receivers: otlp: protocols: grpc: http: processors: batch: exporters: prometheus: endpoint: "0.0.0.0:9464" logging: service: pipelines: metrics: receivers: [otlp] processors: [batch] exporters: [prometheus] logs: receivers: [otlp] processors: [batch] exporters: [logging]
prometheus.yml:
scrape_configs: - job_name: 'otel-collector' static_configs: - targets: ['otel-collector:9464']
docker compose up -d
- Open http://localhost:3000 → login (admin/admin)
- Add Prometheus data source (URL: http://prometheus:9090)
- Import or create a dashboard with the key queries below
| Metric | Prometheus Query | What It Shows |
|---|---|---|
| Token Usage | sum by(model) (claude_code_tokens_total) | Input/Output/Cache breakdown |
| Estimated Cost | sum by(model) (claude_code_estimated_cost_usd) | Real-time $ burn rate |
| Active Sessions | claude_code_active_sessions | Background tasks count |
| Tool Calls | claude_code_tool_calls_total | File edits, commands, etc. |
| Cost per Hour | increase(claude_code_estimated_cost_usd[1h]) | Predictive alerts |
You'll instantly see beautiful graphs of token burn, cost curves, and agent health.
// Full observability pipeline: Claude Code → OTel Collector → Prometheus → Grafana
Key Metrics You Can Track Today
- Real-time token consumption with cache hit rate
- Cost forecasting — hours until you hit your limit
- Background Agent status (
/tasksview + duration) - Productivity ROI (accepted lines of code vs. time saved)
- Anomaly alerts (sudden token spikes = potential runaway agent)
Advanced: Cost Optimization + Multi-Model Strategy
Once you see exactly where your Claude Code spend is going, the next step is smart routing.
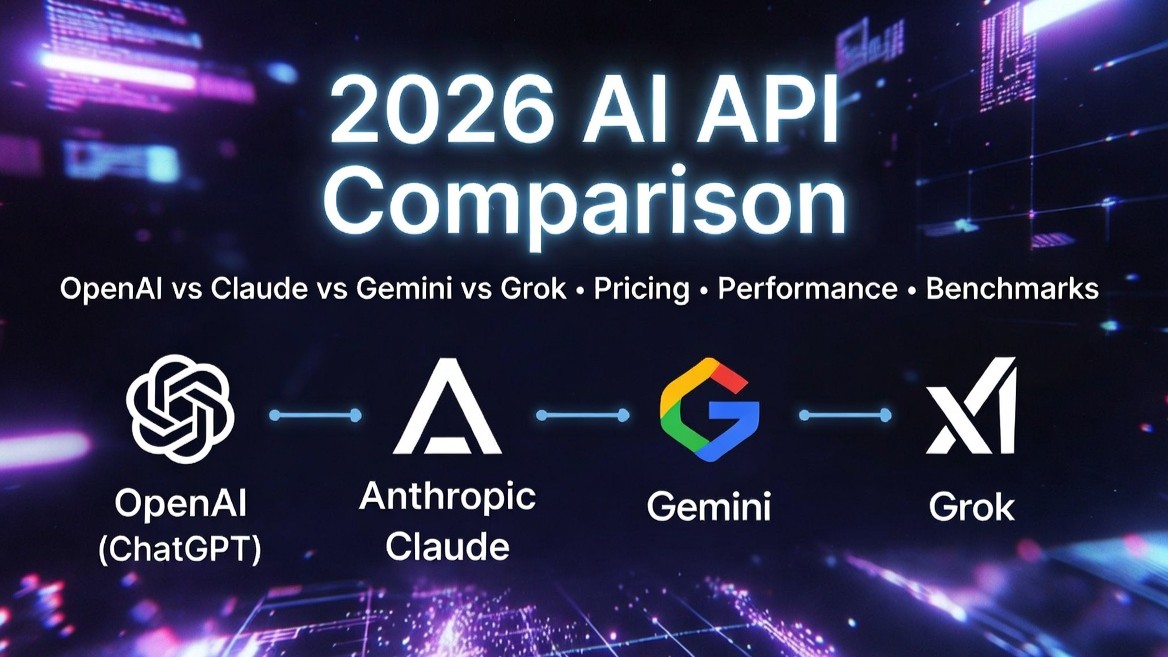
Pro tip: Use a unified OneAPI platform as a smart backend. Route complex reasoning → Claude Code (monitored via OTel). Route high-volume or repetitive tasks → cheaper models (Gemma 4, MAI, Hermes, etc.).
- Built-in usage logging & cost dashboards
- Automatic fallback & load balancing
- Zero-retention privacy options
Result: 30–60% lower costs while keeping full visibility.
Common Questions & Troubleshooting
Yes — telemetry is available on all plans, though cost metrics are more detailed on paid tiers.
Absolutely. The /tasks command + OTel gives you live status of every autonomous agent running in the background.
All data stays in your collector — nothing is sent to Anthropic beyond what you already send for inference.
Check Anthropic's official monitoring guide repo for ready-made Docker Compose and Grafana templates.
Take Control of Your Claude Code Usage
Claude Code Monitor via official OpenTelemetry turns your agentic coding sessions from a black box into a fully observable, cost-controlled system. Combine it with OneAPI — 300+ frontier and open-source models, built-in monitoring, smart routing, and transparent usage dashboards.
Try OneAPI for Free at www.ai.ccLast updated: April 10, 2026 · Sources: Official Anthropic Claude Code Docs & claude-code-monitoring-guide